Quick tour
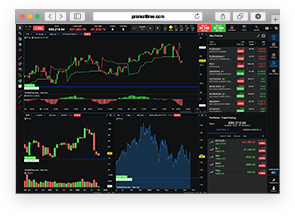
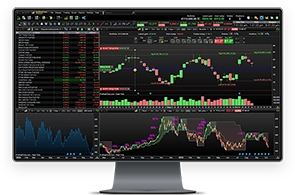
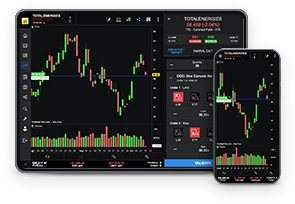
Main window
The main window lets you open all other windows in the platform.

From this main window, you can access the toolbar, which enables you to draw, modify or delete objects and Alerts on your charts. You can also find the search bar here, allowing you to locate instruments and open them as charts or order books.
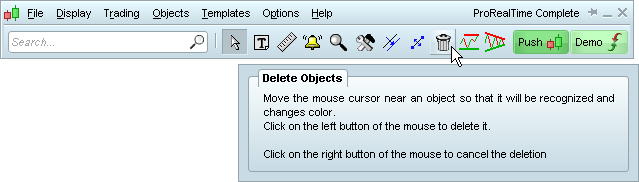
Toolbar

You can personalize your toolbar via the Options menu, or just by a right click over the toolbar itself.
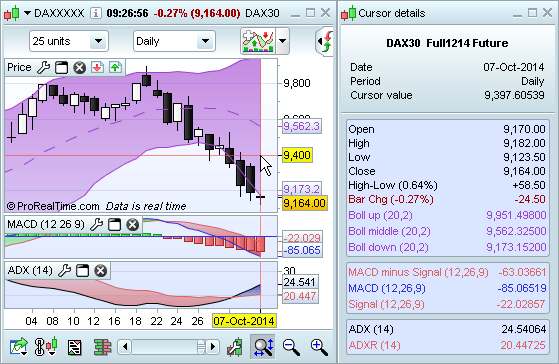
Learn more about the search tool Learn more about drawing objectsCharts & indicators
The chart window lets you view a chart of an instrument and personalize it, adding technical analysis indicators, trend lines and trading systems.

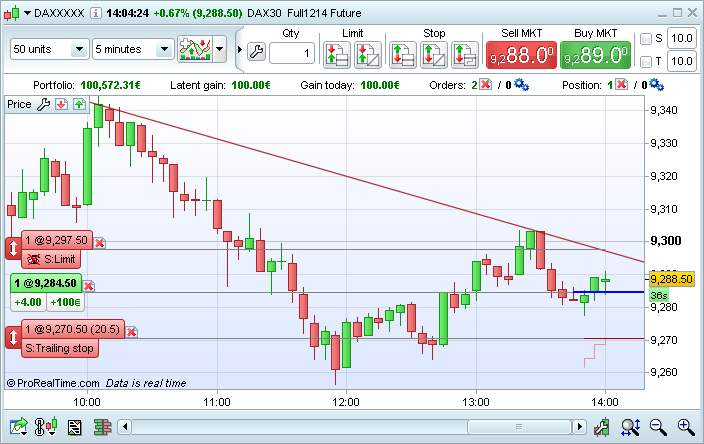
Trading
The trading module enables you to place orders directly through the charts, on the order books and on your lists. The trading interface is completely customizable
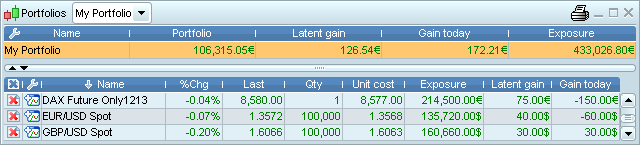
Portfolios
The Portfolios window lets you you track all of your positions and the development of your portfolio.
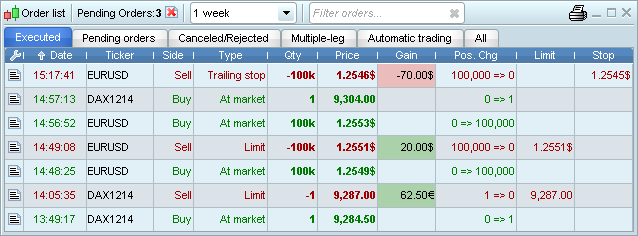
Order list
The order list shows you all pending, executed and canceled orders.
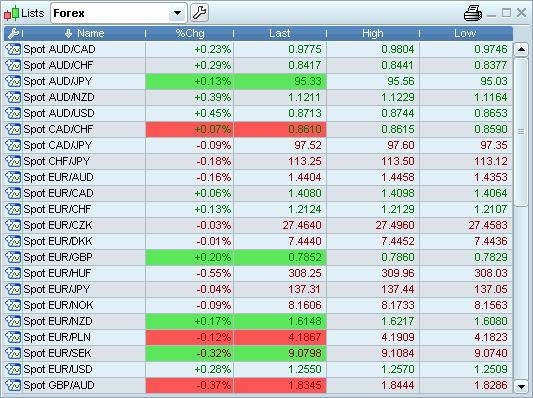
Lists
The lists window allows you bring up lists of instruments and open the corresponding charts by clicking on the line containing the instrument, or by clicking on the chart icon to the left of the instrument name.
You can personalize the information shown, create your own lists and also place orders from lists.
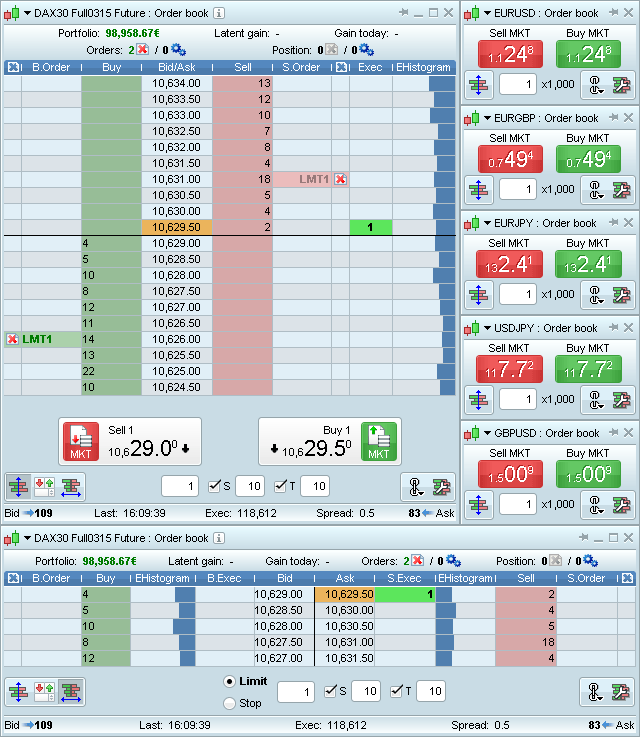
Order book
You can use the order book to see market depth and place your orders. There are three different types of order book available: Vertical, horizontal and best bid/ask.
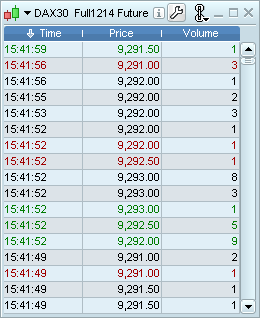
Tick by tick list
The tick by tick list shows the list of ticks (transactions) for the current day.
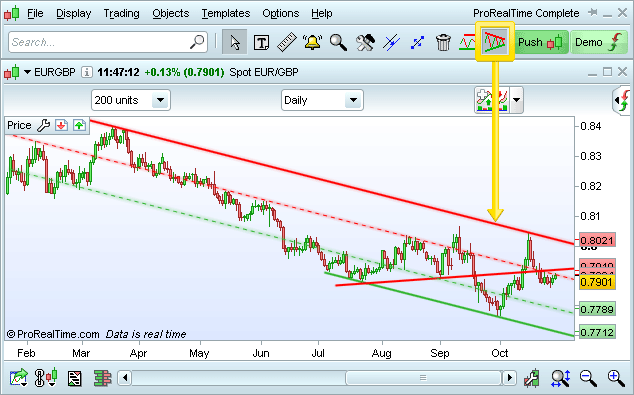
ProRealTrend
The integrated ProRealTrend feature can draw trend lines for you automatically. You can show or hide these trend lines in just one click.
Personal indicators
The ProBuilder module gives you the option to create personal indicators. The powerful code editor can not only be used to create indicators, but also to import and export them, allowing you to share them.
Learn more about personal indicatorsTrading systems
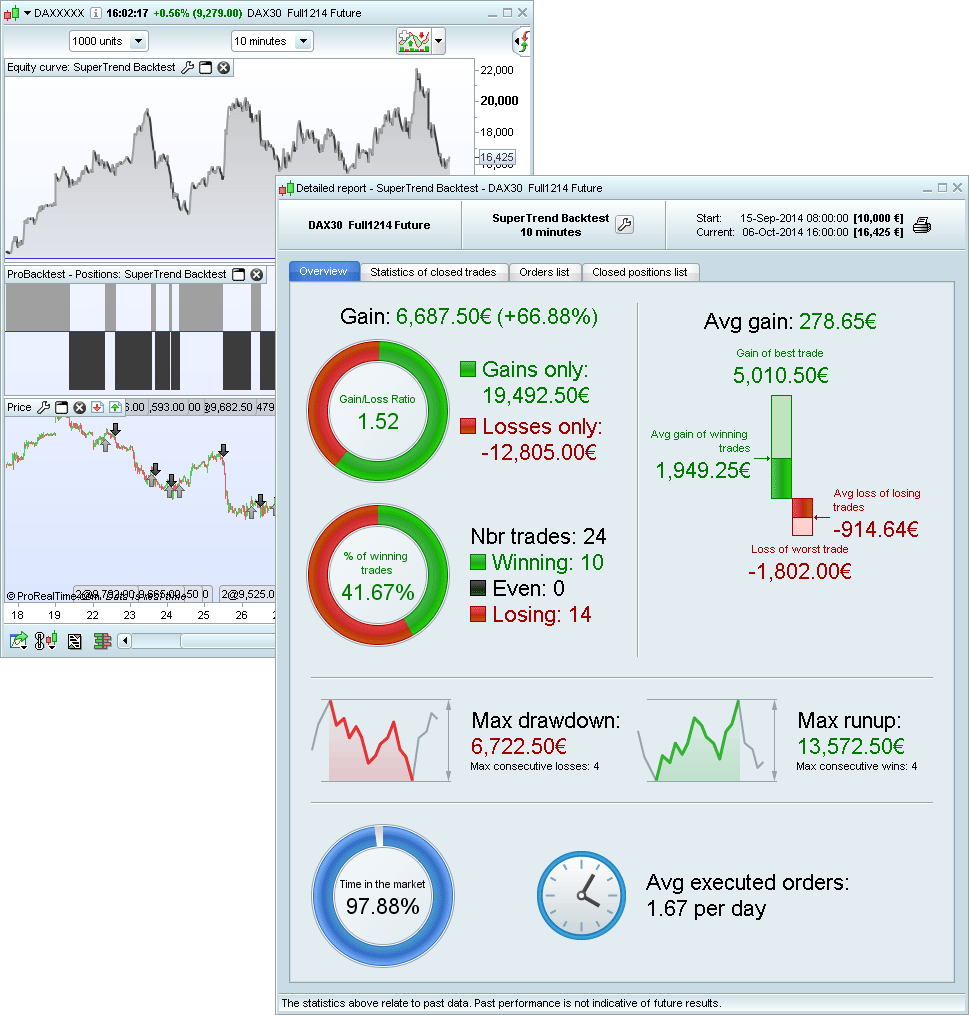
You can create and test your own trading systems with our backtesting module. Using this feature, you can see your system's equity curve, detailed reports, position histograms and orders directly on the chart.
Trading systems can be created without writing a single line of code using the assisted creation wizard, or by direct programming. You can also import and export your trading systems.
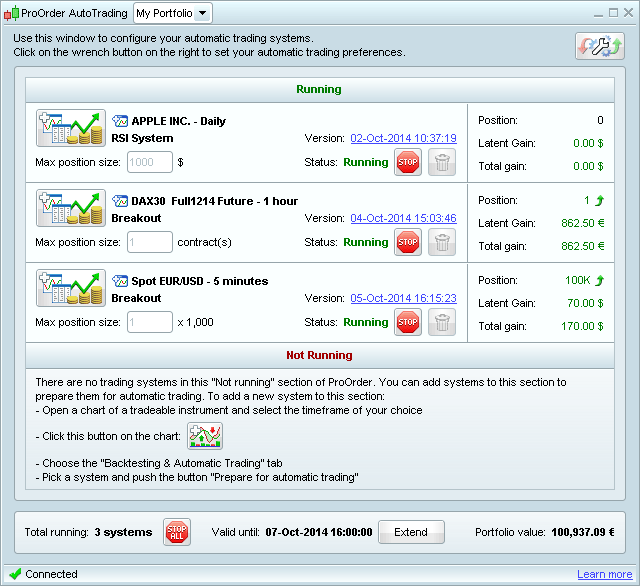
ProOrder Automatic Trading
Once you have created your trading system, you can also use it for automatic trading.
News module
The news module offers professional financial news in real time, shown on the charts and also in the dedicated news window.
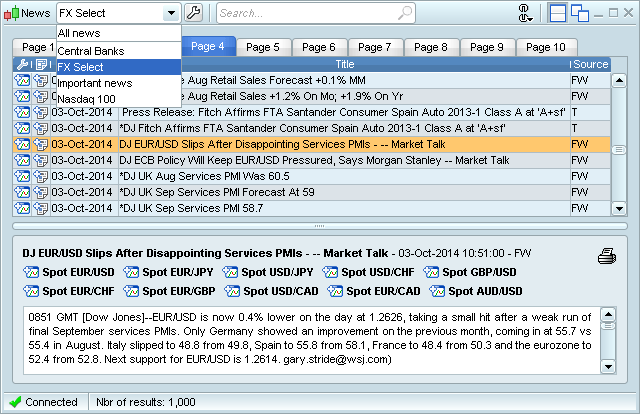
A subscription to Dow Jones News is required to use this module.
Learn more about the financial news packages availableMarket scan tools
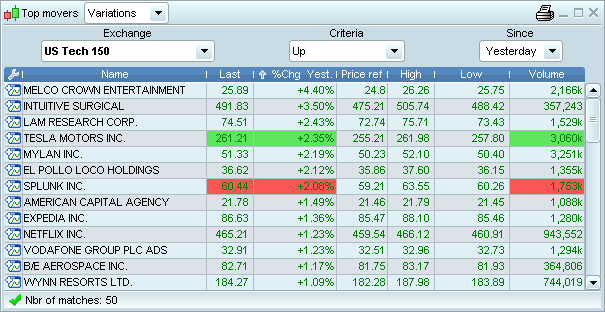
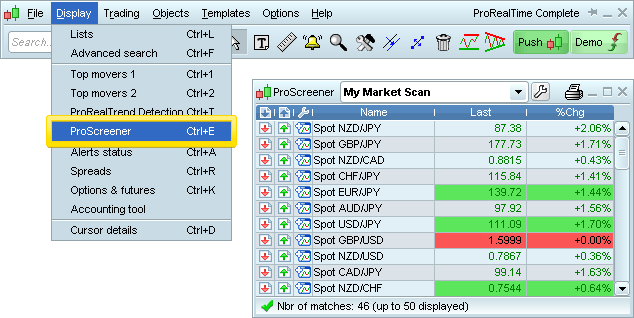
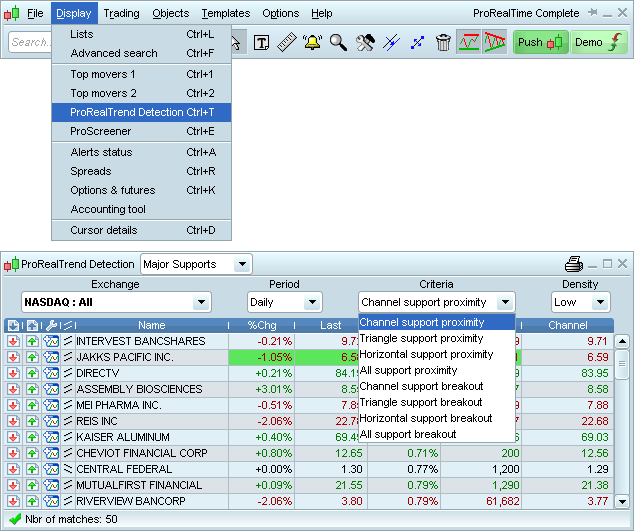
ProRealTime offers several advanced market scanning features.
The Top Movers window shows the top moving instruments according to a selection of preset criteria.
The ProScreener feature can be used to create highly personalized market scans without writing a single line of code via the assisted creation wizard, or by direct programming.
The ProRealTrend Detection feature can detect instruments close to support and resistance lines.
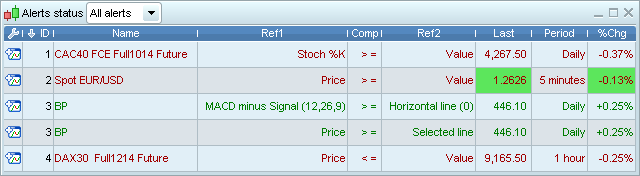
Alerts
You can consult, modify and delete your Alerts via the Alerts Status window.
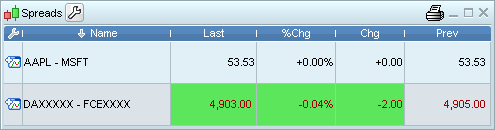
Spreads
Using the Spreads window, you can create, modify and delete your personalized spreads. With real-time access, you can create a real time chart showing 2* Dax Future - 1x CAC40 Future and chart the candles representing this spread over the course of the day.
Cursor details
The Cursor details window lets you display the values of your different indicators at a specific point on the chart by placing your cursor on that point.