MARKET DATA
Trade with professional quality market dataMake your decisions with super fast market data directly from the exchanges
Faster data feed
Benefit from no delay data feeds even on high volatility markets.
Your platform receives and displays ticks with the most responsive "push" data feed.
Instead of receiving quotes "by lots", every new quote issued by the exchange is instantly displayed on your chart.
ProRealTime
Common

Extensive market coverage
- Free access to real-time data feedFree access to CBOE stocks for non-professional users.
- Optional extended market coverage with access to 100% ticks from official exchanges
- Free access to more than 20 additional markets with 10 ou 15 minutes delayed data
- Optional access to real-time data
- Free access to real-time data feed
- Free access to real-time data feed
- Free access to real-time data feed
Pre-open quotes
Display theoretical pre-open quotes on your charts and in your lists. Follow the evolution of the orderbook during pre-open.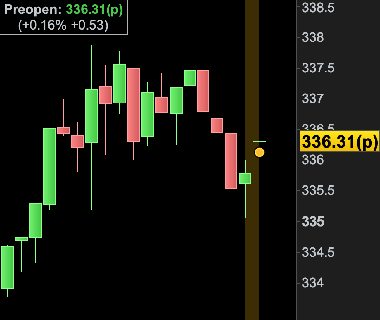
Market depth and order flow
Display market depth for up to 20 lines in the order book (depending on the market). Track bid/ask trends and identify price levels to watch thanks to the order flow.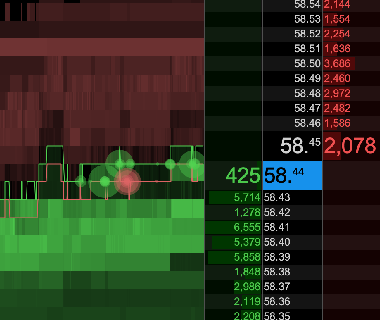
Consolidated data feed and ETH on US stocks
Benefit from consolidated data feeds that include quotes from the main exchange and from alternative exchanges from the same chart. Choose the Extended Trading Hours (ETH) to display pre-open and post-close quotes on your chart.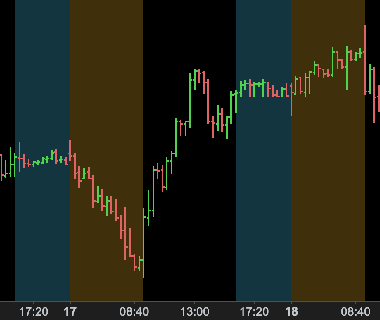
A highly reliable data feed
-
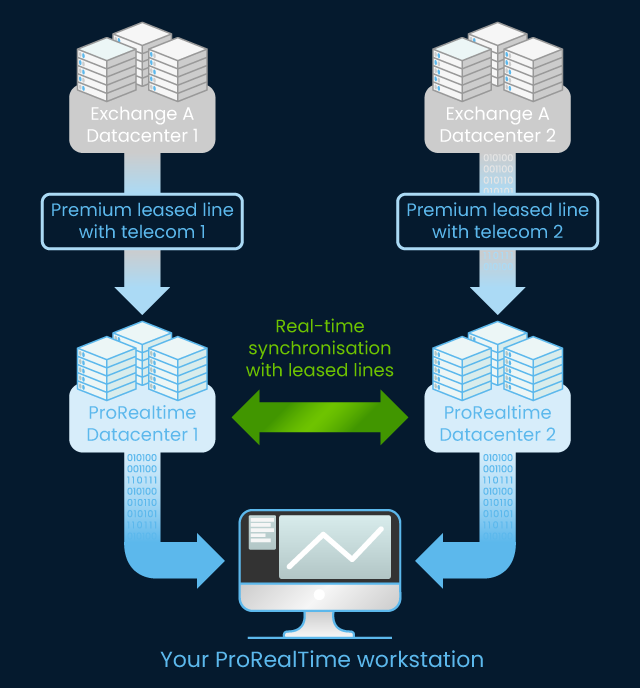
Direct connectivity to the exchanges
For the fastest possible experience ProRealTime is directly connected to the largest exchanges (no intermediaries), using multiple leased lines and fiber-optic connections.
- Redundant architecture
Your platform has access to two separate data feeds and data centers to ensure continuity of our services.
-
24/7 surveillance & maintenance by our in-house teams
Dedicated teams of engineers monitor our data feeds using the latest technologies to ensure reliability in all circumstances.
200 000 candles of intraday history
- For all time frames, 200 000 historical candles are available.
- With the Premium's Historical Mode even up to 1 million candles available
| 15 minutes | 5 minutes | 1 minute | 500 ticks | 1 hour | daily | |
|---|---|---|---|---|---|---|
| Premium version |
18 years |
18 years |
10 years and 2 months |
15 years and 10 months |
18 years |
May 1986 |
| complete version |
18 years |
10 years and 2 months |
2 years |
3 years and 10 months |
| 15 minutes | 5 minutes | 1 minute | 500 ticks | 1 hour | daily | |
|---|---|---|---|---|---|---|
| Premium version |
17 years and 9 months |
13 years and 3 months |
2 years and 7 months |
12 years and 9 months |
25 years and 9 months |
June 1979 |
| complete version |
7 years and 11 months |
2 years and 7 months |
6 months |
2 years and 2 months |
| 15 minutes | 5 minutes | 1 minute | 500 ticks | 1 hour | daily | |
|---|---|---|---|---|---|---|
| Premium version | 18 years | 14 years |
2 years and 9 months |
1 years and 9 months |
23 years and 6 months |
Sept 1997 |
| complete version |
8 years and 6 months |
2 years and 9 months |
6 months | 4 months |
| 15 minutes | 5 minutes | 1 minute | 500 ticks | 1 hour | daily | |
|---|---|---|---|---|---|---|
| Premium version |
17 years and 7 months |
17 years and 7 months |
4 years and 8 months |
17 years and 7 months |
27 years | Jan 1997 |
| complete version |
14 years and 1 months |
4 years and 8 months |
11 months |
7 years and 8 months |
| 15 minutes | 5 minutes | 1 minute | 500 ticks | 1 hour | daily | |
|---|---|---|---|---|---|---|
| Premium version | 18 years | 18 years |
10 years and 3 months |
17 years and 9 months |
20 years | Jan 1950 |
| complete version |
18 years |
10 years and 2 months |
2 years |
17 years and 9 months |
Charts in all timeframes
-
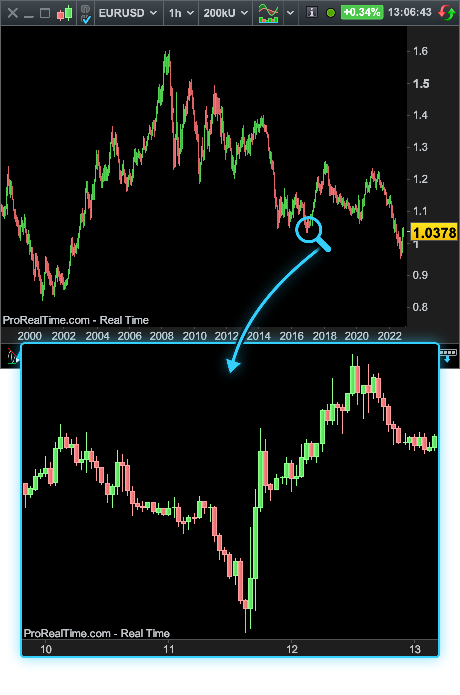
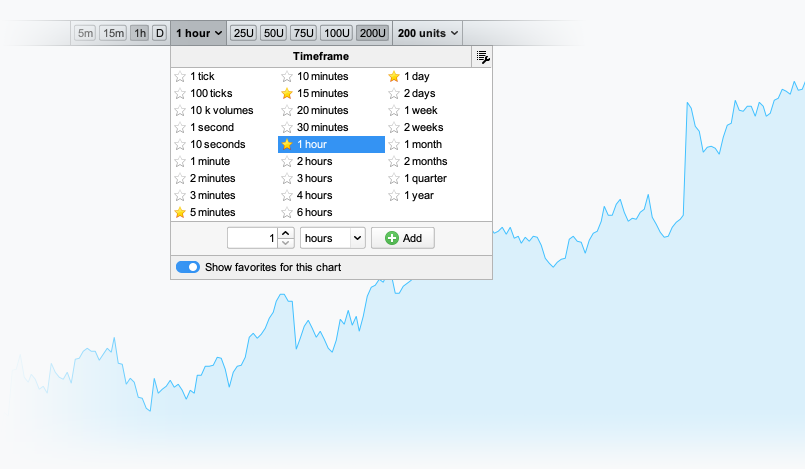
Unlimited possibilities for the choice of the timeframe
Create and save your favorite timeframes in ticks, seconds, minutes, hours, days...
-
Access to non-time based views with "x-ticks" and "x-volumes"
These exclusive views are based on price movements (or volumes), which will help you:
- detect activity peaks on a given security
- confirm your intraday analyses on regular timeframes
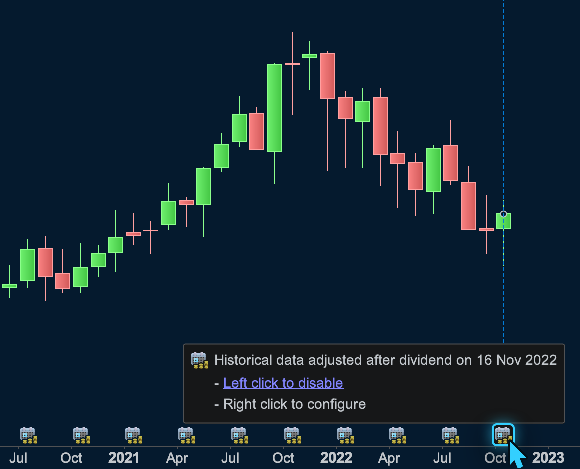
Adjust charts for dividends and rollovers
- For dividends (on stocks)
Adjust your charts and computation of your indicators for the gaps made by dividends.
- Rollovers (on futures)
- Display continuous charts representing all past contracts on the same underlying
- Adjust historical data to rollovers on continuous charts to avoid gaps on contract rollover
Adjust your charts to your time zone
- Use your time zone, the time zone of the market, or any other time zone you want
- Use a global setting for the whole platform, or choose a time zone for each market individually
- Apply your configuration to your charts and to the computation of your indicators in intraday only, or also in daily and higher timeframes