Order display
Display of pending orders and open positions on charts
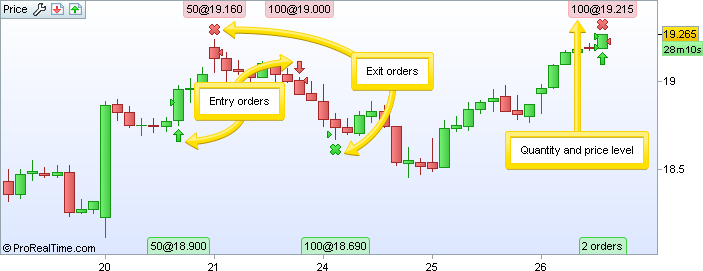
Orders, positions and trading information can be displayed directly on charts in ProRealTime.
- Pending orders are represented by red lines for sell orders or green lines for buy orders.
- Open positions are represented by thick blue lines at the level of the average price of the position (useful for cumulated positions)
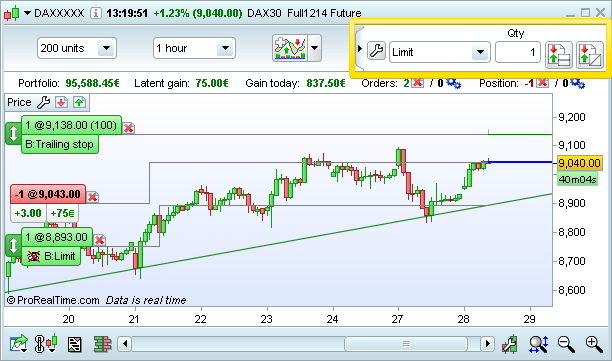
On the left side of each order line, a tab illustrates the most important information concerning the order or position:
For positions:
- Color: The upper part of the tab is colored green for a long position and red for a short position. The lower part is colored green if the position has a latent gain and red if it has a latent loss.
- Quantity and average price: The upper part of the position tab shows quantity@average price.
- Gain or loss in tick size: The lower part of the position tab shows the gain or loss in terms of tick size.
- Red cross: Lets you close the position
For pending orders:
- Color: Buy orders will be displayed in green, sell orders will be displayed in red.
- Volume & price: shown as quantity at (@) the current price level for a pending order. The price level of oblique orders and trailing stops can change.
- The eye shows the order's status:
 The order is server-based and may be processed even when your platform is closed.
 The order is stored in the software only and can not be executed when the platform is closed (a warning will be displayed when you close the platform if soft orders are pending). This only applies to a few types of orders (ex: orders based on Alerts or oblique lines).
- Order type and direction
-
 : lets you delete the order
- Validity: The end-point of an order shows its validity - orders that extend infinitely into the future have a GTC validity while orders whose lines stop at the end of the day or a specific date are valid until that point.
- Modify: the icon
 allows you to modify the price level of a pending order. Click on the icon and the line will follow the cursor of the mouse until you click a second time. The order will be set at the new price level, while the other settings remain unchanged.
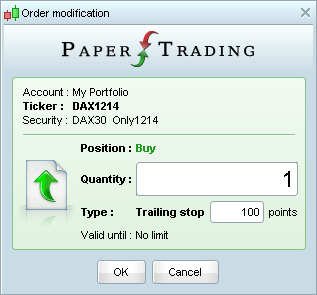
It is also possible to modify an order by right-clicking on the line and selecting the "Modify" option. A new window (see image below) will allow you to modify the pending order.