Assisted creation


Create a ProScreener in Assisted Creation mode
Before starting with the Assisted Creation wizard, we suggest you prepare an example chart displaying the indicators that you want to base your scan on. The security displayed does not matter, only the indicators displayed will be considered.
For example, open a chart and add the Moving Average and RSI indicators, if you are planning to create a scan whose criteria is based on the Moving Average and the RSI indicators.
Click first on the "Set ProScreener" button on the main ProScreener window, then on "New ProScreener" and select the Assisted Creation tab and follow the three steps shown and described below.
Definition of conditions
Click on the "ProScreener Conditions" button to set your scanning criteria and a new window appears (see below).
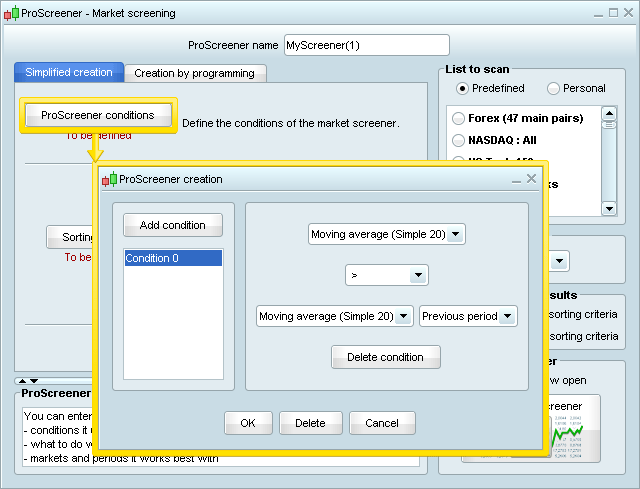
Click on "Add condition" and move the cursor to the example chart prepared: click on the section of the chart that displays the indicator of your first condition.
The wizard automatically detects the elements shown in the chart and displays them in the drop-down menus.
- Two drop-down menus display the indicators shown on the chart you clicked on.
- A drop-down menu gives the choice of the condition to set (ex: >, =, >=, ...).
- A fourth menu gives the possibility to refer to the value of the second indicator in the previous or the current period (to use more advanced criteria, see the next section of this manual).
Example: Scan for securities with increasing Moving Average
A Moving Average is increasing when its current value is higher than its previous value.
To set this condition, we just have to select "Moving Average" in the first menu, the symbol ">" in the second, then "Moving Average" again and "Previous period".
To create a multiple-condition scan, click on the "Add condition" and proceed in the same way: just click on the chart that contains the indicators of your interest.
A new drop-down menu appears below and gives you the possibility to set if the results of the market scan have to match all conditions or at least one condition.
Every condition set is listed in the left area of the window. To modify or delete a condition, just select its name and apply your modifications or click on the "Delete condition" button.
Definition of sorting criteria
A ProScreener can show up to 50 results; if more than 50 securities match the criteria set, the results are filtered using custom sorting criteria.
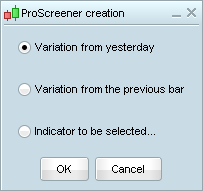
Click on "Sorting criteria" and a new window will display three "indicators" that may be used to filter and set the order of your results:
- The performance from the previous day
- The performance from the previous day (if your scan runs on daily views, there is no difference between these two choices)
- The value of an indicator of your choice. In this case, you can choose the indicator in the same way you set the conditions in the section above.
Click "OK" to finish and get back to the main Assisted Creation window.
Generation of code
Click "Generate Code" to access the Creation by Programming window: the code you just generated through the wizard will be displayed automatically.
If you are not familiar with code programming, there are just three elements you may want to consider in this window (see image below).
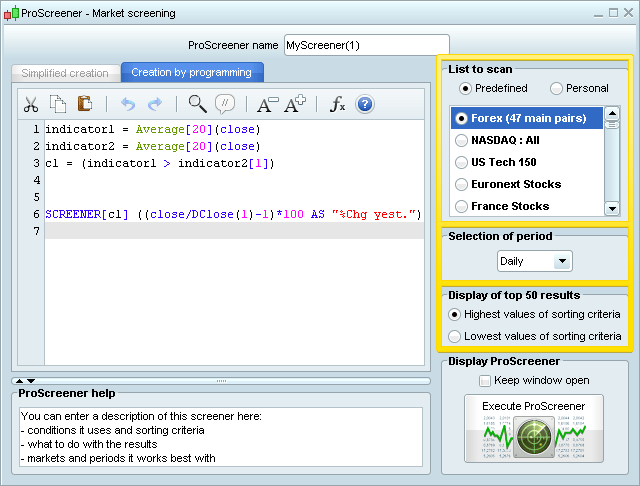
- Selection of list: define the market or the list your scan should run on
You can choose between a predefined list or a personal list. If you want to apply ProScreener to a personal list, you need to make sure that all the securities in the personal list are part of the same market. - Selection of Period: define the timeframe in which your conditions should be verified.
The period used for the detection is important because the conditions you are looking for in one timeframe may be different in another time frame.
If you created a multi-timeframe scan, your code contains TIMEFRAME(DEFAULT). In this case, the option selected in the "Selection of period" drop-down menu will only apply for the timeframe of the first "example chart" used. -
Display top 50 results: concerns the sorting criteria only. When displaying the results, ProScreener filters the securities based on the sorting criteria defined in the step two. You can choose whether you want to display the securities with:
- highest values of the sorting criteria
- lowest value of the sorting criteria
Example:
Imagine your ProScreener searches for NASDAQ stocks whose volume is higher than 20000 on a daily view. The number of results will logically exceed 50.
In your code, you can define volume as the sorting criteria and choose to display the highest 50 values of sorting criteria (which will return the securities with TOP volume first) or lowest values of sorting criteria (which will return the securities with LOWEST volume). Any result shown will meet the conditions of the screener first.
Click on "Validate Program" and your ProScreener is ready to run.