Identify hot zones
Highlight hot zones around the support and resistance lines to identify more clearly when the price approaches a significant level.
Display / hide the automatic trend lines as you wish
Available on all instruments in all timeframes
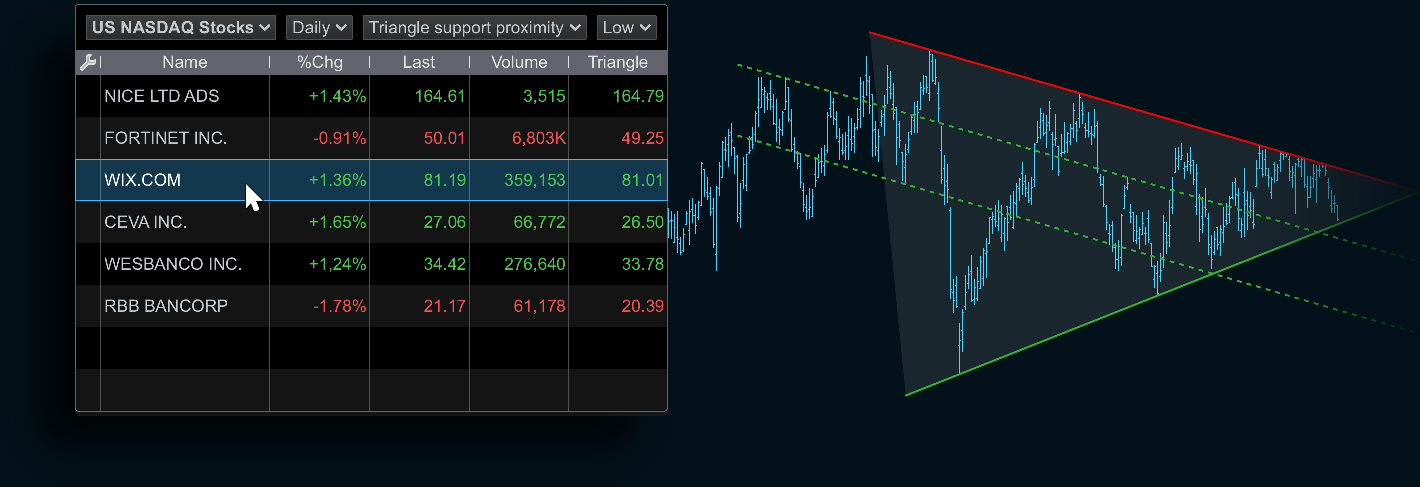
Automatically find stocks close to a breakout
Identify support and resistance levels automatically with horizontal ProRealTrend lines.

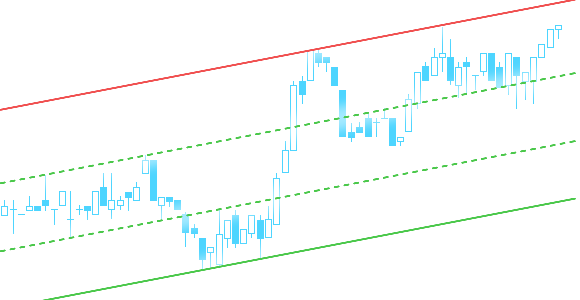
Display oblique ProRealTrend lines to quickly identify the trend on any chart.
Highlight hot zones around the support and resistance lines to identify more clearly when the price approaches a significant level.
Set alerts on ProRealTrend lines and get notified as soon as the price reaches a support or resistance.
Place orders on horizontal and oblique ProRealTrend lines. These orders will be transmitted to the market as soon as the price crosses the selected line.
The ProRealTrend Detection tool allows you to scan markets and find stocks that are about to reach a support or a resistance level.