ProRealTrend
Display horizontal support and resistance lines
Click on the horizontal ProRealTrend icon  to display the following levels:
- Major horizontal support and resistance lines
- Intermediate horizontal support and resistance lines
- Minor horizontal support and resistance lines
These horizontal levels are available in end of day views. Extra horizontal lines are available in intraday views and (x)ticks with real-time enabled accounts.
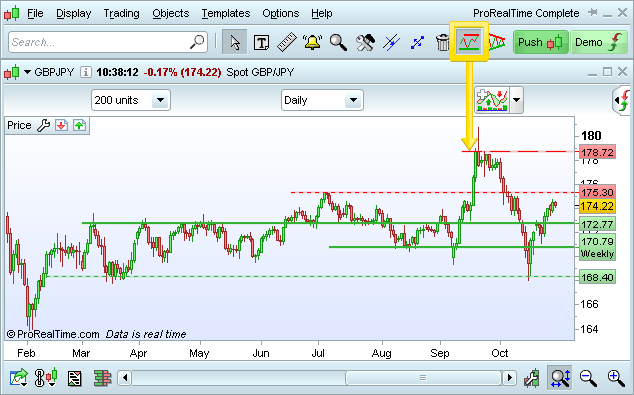
ProRealTrend lines are automatically updated with the latest analysis.
Display channels and oblique support and resistance lines
Click on the oblique ProRealTrend icon  to display the following levels:
- Major oblique support and resistance lines
- Minor oblique support and resistance lines
These oblique lines are available in end of day views. Extra oblique lines are available in intraday with real-time enabled accounts.
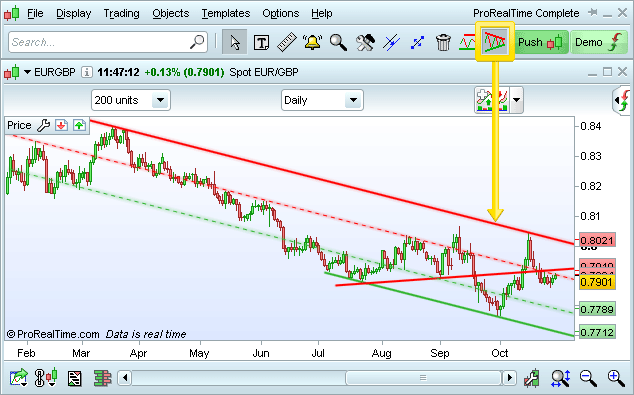
ProRealTrend lines are automatically updated with the latest analysis.
Customize any type of ProRealTrend line
ProRealTrend lines come with the powerful customization capabilities of ProRealTime objects. To customize your ProRealTrend studies, click on "ProRealTrend settings" in the "Options" menu of the main window.
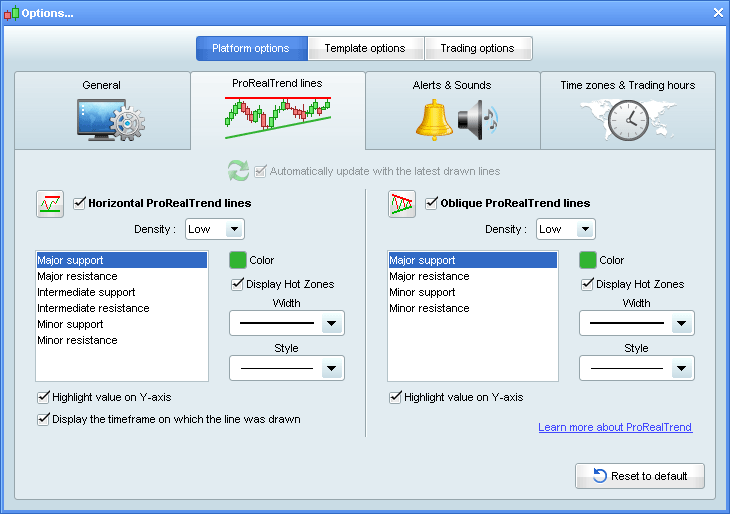
You can
- Set the density: amount of lines to display (low, intermediate, high)
- Define colour, width and style for each type of line
- Display "Hot Zones" close to ProRealTrend lines
- Add a text box to indicate the timeframe in which the line was calculated.
- Automatically update ProRealTrend analysis with the latest drawn lines.
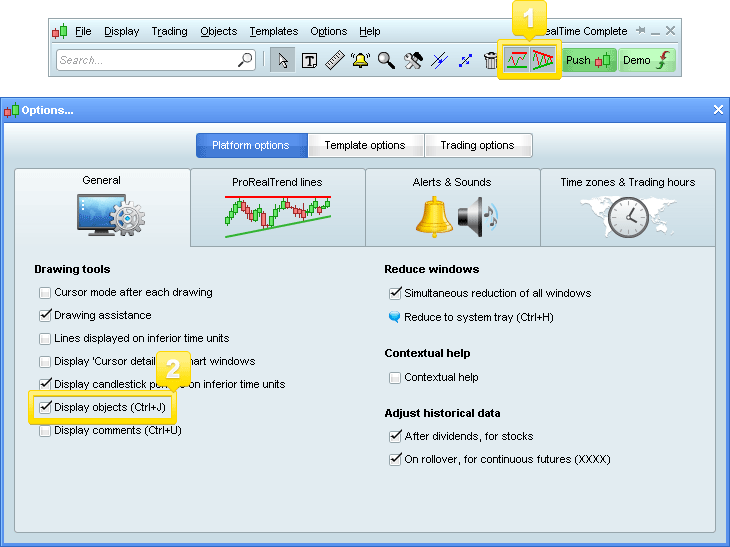
Crosscheck ProRealTrend with your own studies
You can display both ProRealTrend lines and your own studies or choose to view either one of them individually.
1) To display ProRealTrend lines, just click on the corresponding ProRealTrend icons.
2) To hide or display the objects you have drawn manually, click on "Display objects" , from the "Options" menu in the main window.
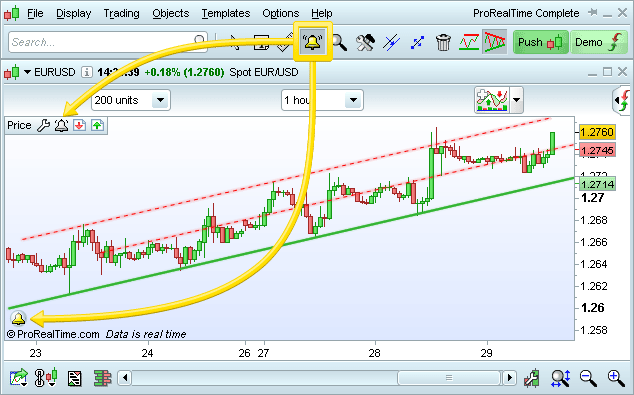
Set Alerts
You can set Alerts on ProRealTrend support and resistance lines, just like you can on your own lines. Once the Alerts are set, the ProRealTrend lines become standard lines (drawn objects). Hiding ProRealTrend lines will not remove the Alerts.
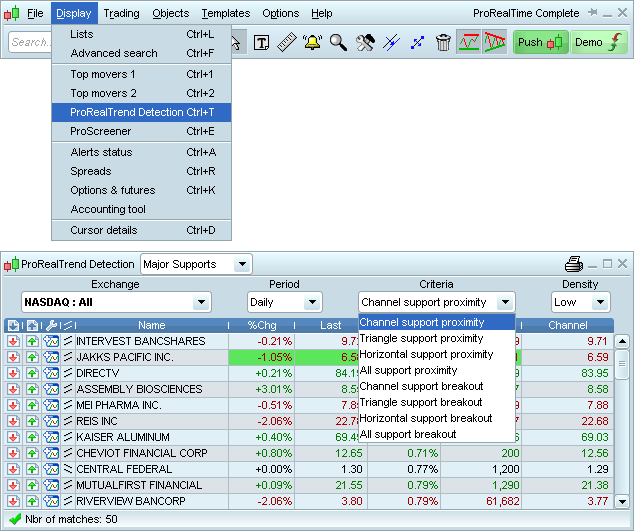
ProRealTrend Detection
With ProRealTrend Detection you scan markets and obtain the securities whose price is approaching ProRealTrend levels. The results of the scanner are updated in real-time, just like ProScreener!
Display "ProRealTrend Detection" window by clicking on "Display menu" in the main window.
You can configure the detection tool in order to fit your trading style with the criteria below:
- Market: scan entire markets
- View: monthly, weekly, daily, hour, 15 mins, 5 mins
- Proximity and breakout: major/all support and resistance channels, triangles or lines