Historical data and timeframe
At the top of each chart, two dropdown menus are used to configure:
- The amount of historical data
- The chart timeframe
Amount of historical data loaded (left dropdown menu)
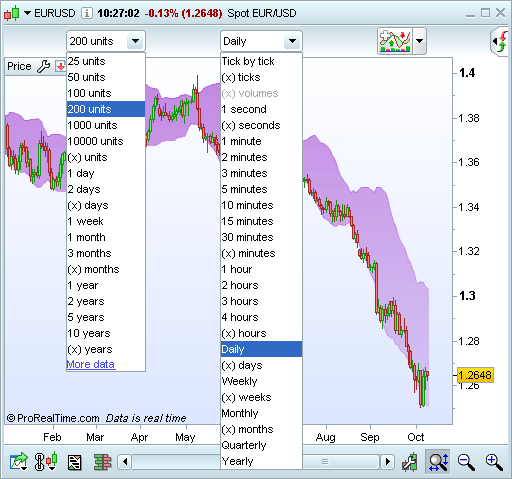
The left-hand dropdown menu can be used to configure the amount of historical data to be shown in the chart. You have the choice of number of units (ex. 200 units), or a period of time (ex: 1 month, 10 years).
For views in units, 1 unit corresponds to 1 candle. Example: by selecting 200 units and Daily from the left and right menus respectively, the chart will show 200 candles, each representing a day, therefore showing 200 days of trading (see image above).
For long term analysis using all data history available, select (x) units from the left-hand dropdown menu, and enter 100 000 units into the field that appears.
The amount of historical data shown directly affects the loading speed of your charts. As a result, it is recommended to avoid showing the maximum data history on a permanent basis.
Chart time frame (middle dropdown menu)
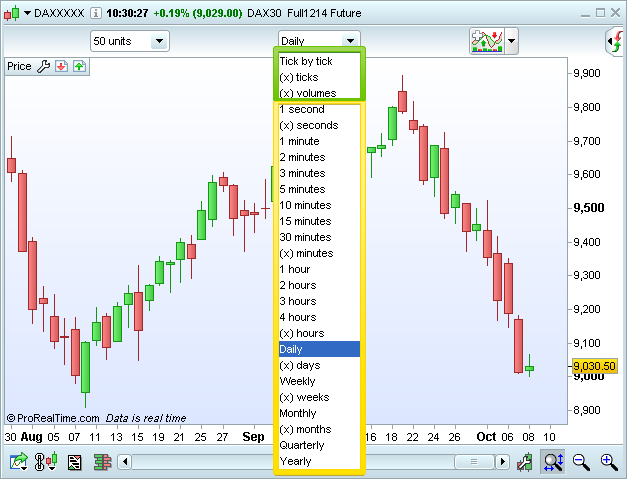
The right-hand dropdown menu controls the timeframe, or the period that each candle represents. For example, a choice of 5 minutes using candlesticks would show each candlestick representing 5 minutes of time.
The most frequently used time frames are those based on units of time (highlighted in yellow in the example below). ProRealTime also offers non-time based views based on liquidity, such as volume, or number of transactions (highlighted in green below).
Time based views
The most common time based views (5 minutes, 1 hour, daily) are available as standard in the dropdown menu.
You can also create personalized time frames to suit your own style, using the (x) time frames: (x) seconds, (x) minutes, (x) hours, (x) days, (x) weeks and (x) months.
Example: You can create 100 minute candles, or 12 second candles.
Non time based views
The non-time based views available are:
- Tick by tick: In this view, each individual transaction is shown on the chart. Therefore, Tick by tick is shown as a continuous line, and cannot be shown as a candlestick.
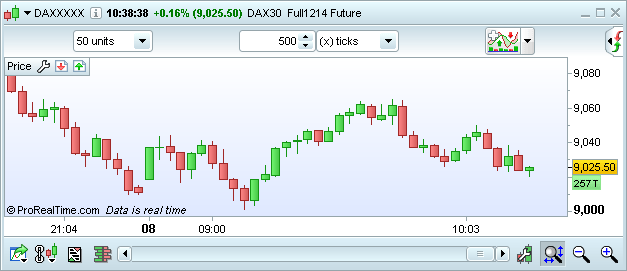
- (x) ticks: Each candle is constructed using a defined number of (x) transactions, or ticks. Once the defined number of tick is reached, the candle closes and a new candle begins.
- (x) volumes: Each candle is constructed using a defined number of (x) volumes. Once the defined number of volumes is reached, the candle closes and a new candle begins.
Non time based views provide additional information, notably by offering easier way to see the impact of volumes on price movement.
The time scale (x-axis) will adapt to non-time based views. As we can see in the chart below, the amount of transactions that took place in the first hour of trading much higher than the amount in later hours.
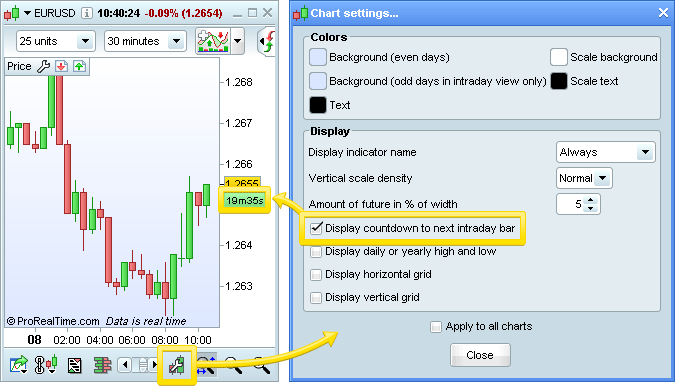
You can show a time (or tick) countdown to the next candle by clicking on the Chart Properties icon (the wrench symbol in the bottom right hand corner of your chart), and checking the "Display countdown to next intraday bar" option in the popup menu.