Chart properties
The  icon in the bottom right hand corner of your charts gives you access to the "Chart Settings".
Through this, you can customize the chart display options that are unrelated to indicators.
To learn how to personalize chart indicators and how the price display styles, check the Indicators & price section.
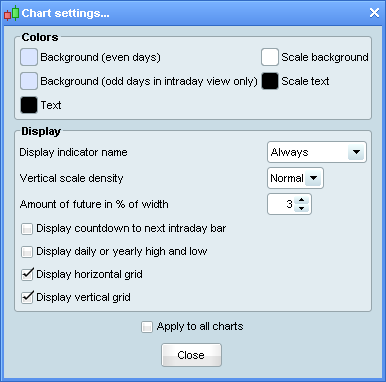
From this menu, you can:
- Personalize the color of your chart, text and scale
- Choose different colors for alternate days in intraday views
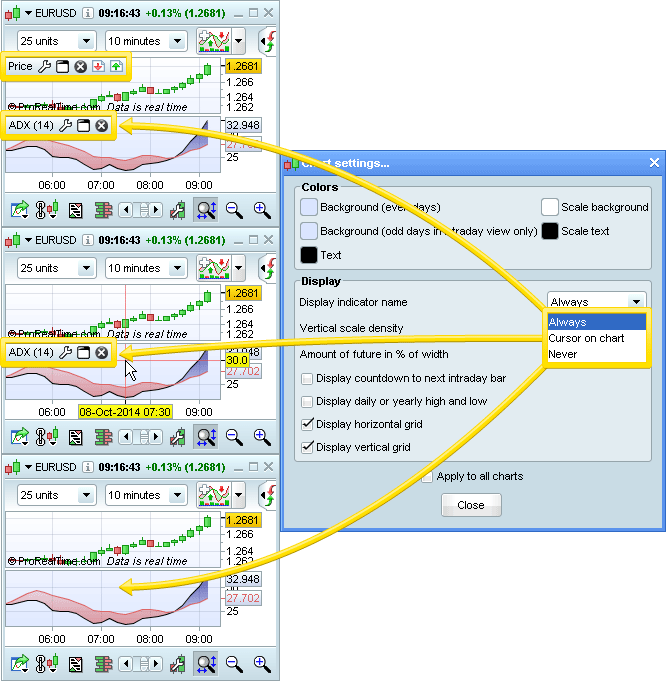
- Display/hide indicator names
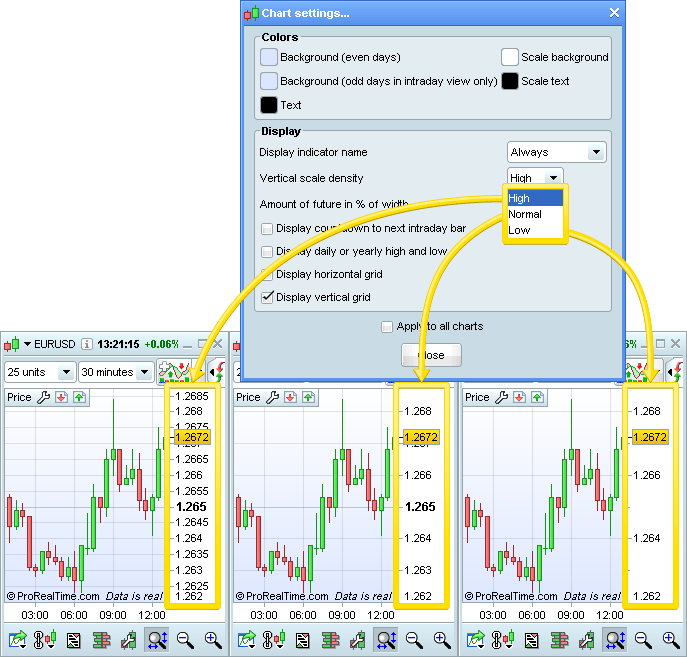
- Choose the vertical scale density
- Display/hide countdown to next intraday candle
- Choose the amount of future (in %) to be shown to the right of the candles (used to get a better view of chartist-based projections)
- Display daily/yearly high and low at the top of the chart
- Display/hide vertical (time) and horizontal (price) grids
These settings can apply only to the chart selected, or to all charts by checking the "Apply to all charts" option.
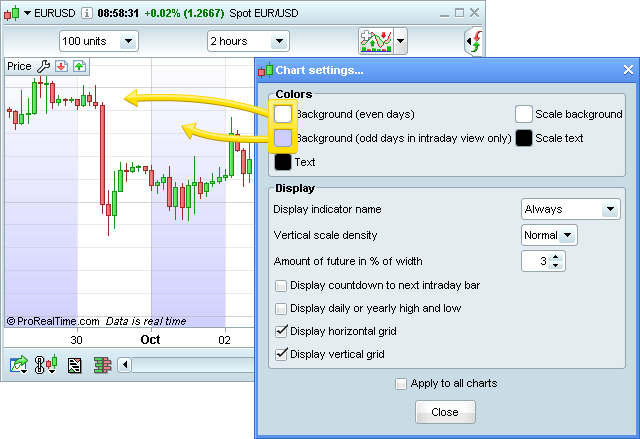
The image below shows how to change the background for even and odd days.
The image below shows how to display or hide indicator names.
The image below shows how to configure vertical scale density.