Price
Price chart styles
ProRealTime offers a large selection of chart styles that you can choose by clicking the  icon.
icon.
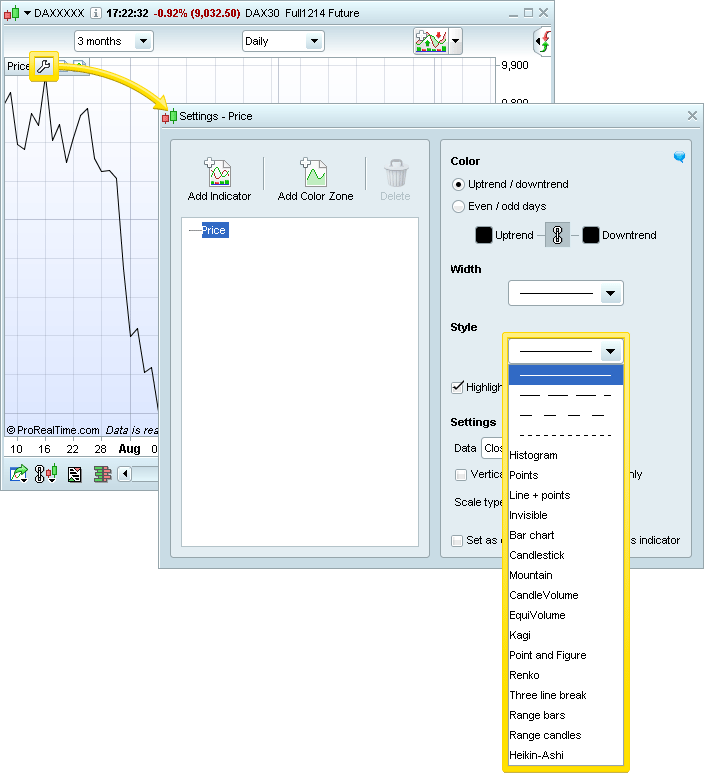
Here is the list of styles available:
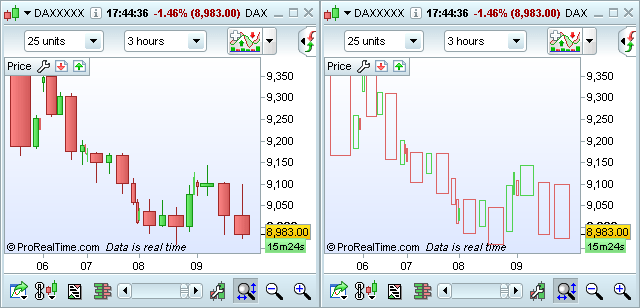
Time-based chart styles:
- Candlesticks
- Bar charts
- Heikin-Ashi
- Histogram
- Mountain
- Lines (continuous lines, dotted lines, points, line and points...)
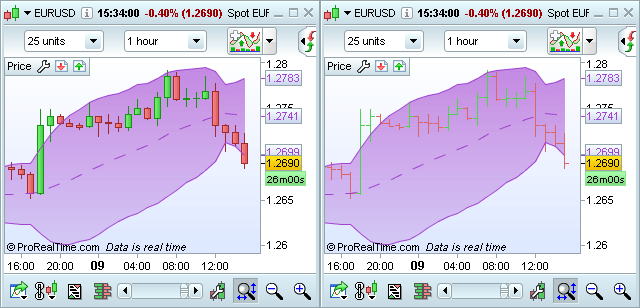
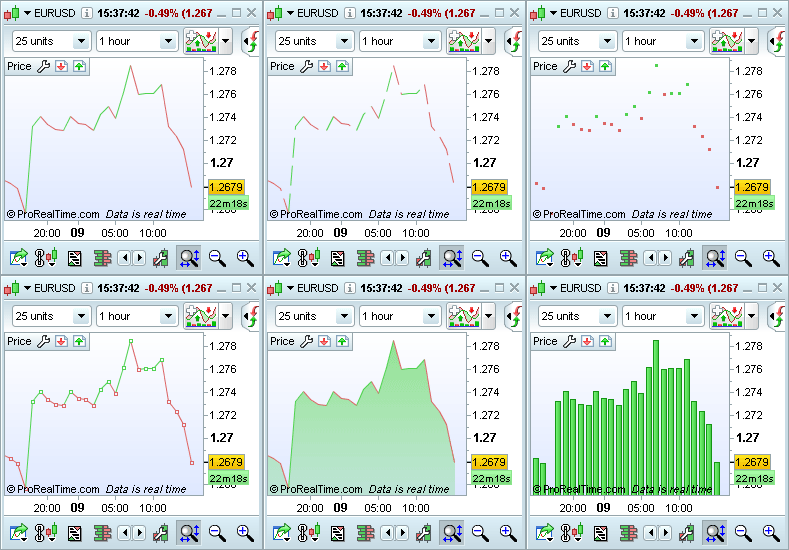
Chart styles based on price movements:
- Point and figure
- Kagi
- Three line break
- Renko
- Range bars and range candles
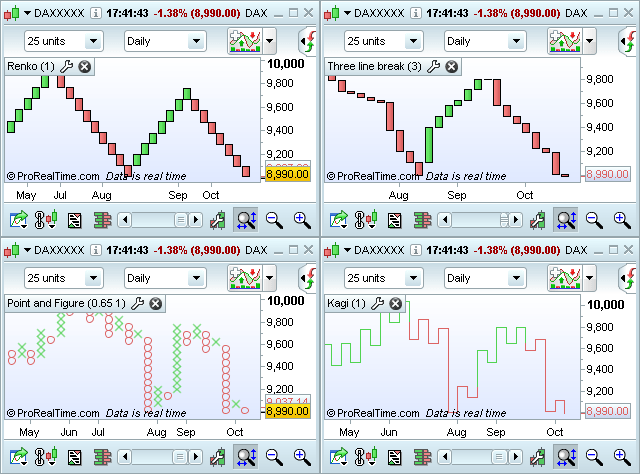
Chart styles based on volume:
- CandleVolume
- EquiVolume
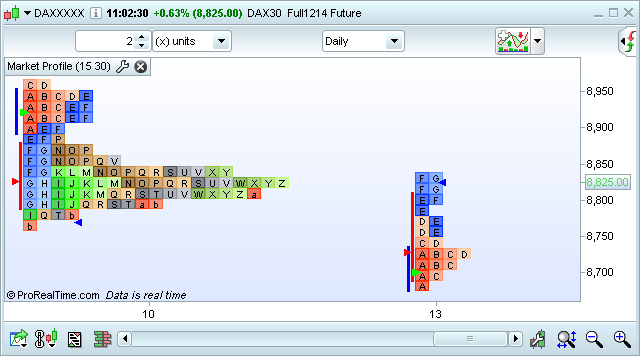
Optional chart style:
Market Profile is available as an optional module and is not available in all versions of the platform.
Price style customization
The price styles are customizable from the price settings window which can be opened with the icon.
For most styles, you can modify:
- The color of the price for increasing and decreasing values
- The thickness of candlesticks, lines and boxes
- The data on which the price chart is calculated
- The type of scale (linear, logarithmic, % relative)
- The display of the last price on the vertical axis
Available options depend on the price style selected. Here are some examples:
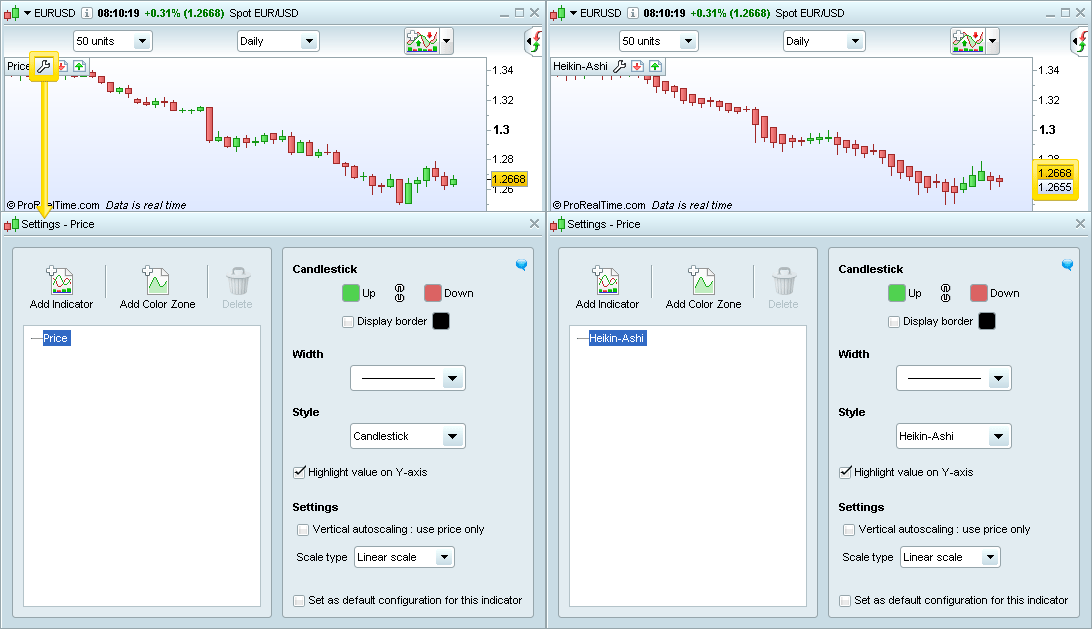
Note that the if the last price of the chart style is different from the last real price quoted (ex: Heikin-Ashi chart), both values are displayed on the price axis with the last real price in yellow (see the zone highlighted above).
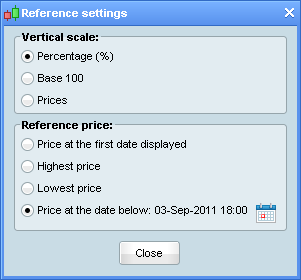
Types of price scales
The images below show examples of linear, logarithmic and relative which can be chosen from the price settings window.
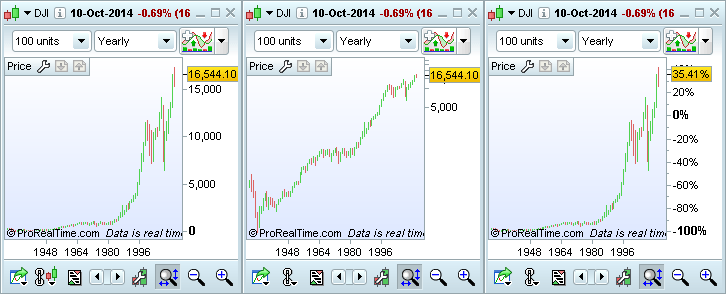
Linear price scale is a standard price scale where the distance between two points shows the change in price between those two points. This is the most commonly used type of scale. Example: the distance between 10 and 20 will be the same as the distance between 20 and 30.
Logarithmic scale will show an equal distance between two points if the % difference between them is the same. Example: the distance between 10 and 20 will be the same as the distance between 20 and 40 (100% difference). This type of scale is useful for analyzing price changes.
Relative scale shows the vertical scale relative to a "reference price" . This scale can be displayed in %, base 100 or in Price. If for example we define the reference price as September 04 2011 for a relative % scale, all subsequent and previous values of price will be expressed as a percent variation from the price at that date and time.