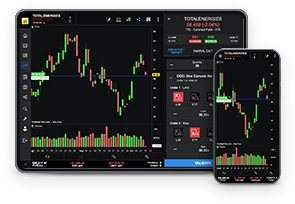
Drawing tools
The following guide will help you learn to use the most commonly used drawing tools. Additional tools may also be added to your toolbar as described at the end of this page.
Tip: Clicking on the right button of the mouse while using any tool described in this section will cancel the last action. This is useful when you click on the chart by mistake, having previously clicked on a tool icon.

A. Cursor Mode (Default Mode)
The  icon corresponds to the Cursor Standard Mode, which is selected by default. Left-click anywhere in the chart, hold it down and move your cursor. The chart will display different sections of the chart along the horizontal and vertical scales.
B. Ruler
The  icon lets you draw a ruler on your chart. The ruler is useful to measure the distance between two points on the chart. Horizontally, it measures the distance in number of bars and also the amount of time passed. Vertically, it measures the distance in tick sizes and in percent.
C. Create an Alert
The  icon allows you to create an Alert. Click on the "bell" and then in the chart displaying the security upon which the Alert will be set. Please refer to the section "Create Alerts" for details.
D. Zooming into the chart
The  icon is the zoom button. Left-click to set the first date of the time period which you wish to zoom. Move the mouse and click again on the left button to set the second date. Note that on a zoomed view, you can use the horizontal scroll bar at the bottom of the chart to see quotes from previous or later dates with the same zoomed view.
E. Drawing a segment or a line
The  icon allows you to draw segments. Left-click on the chart area where you intend to set the first point of your segment. Next, move the mouse cursor and left-click again to set the second point of the segment. The segment will then be drawn automatically.
The  icon allows you to draw lines. The method to draw lines is similar to the method of segment drawing. Left-click to define the starting and end point of your line.
The  icon allows you to draw horizontal lines.
The  icon allows you to draw vertical lines.
Tip: The platform can help you draw precise lines with drawing assistance.
Go to the menu "Options" and make sure "Drawing assistance" is checked. Each time you place the mouse cursor near a specific point in the chart (high, close, open) or near an indicator specific point (Bollinger, oscillator..), this point will automatically be the starting point of your line. The Drawing assistance will help you to find the second point of your line.
F. Drawing Fibonacci lines
Select the Fibonacci levels icon  and click with the left button on two points in the chart to define the two extreme points of the Fibonacci levels. A series of horizontal lines are drawn at the Fibonacci levels of 0.0%, 23.6%, 38.2%, 50%, 61.8% and 100% of the trendline.
Fibonacci levels can be customized using the "Properties" feature, accessible in the toolbar of the main window by clicking on this icon:  . The lines will keep their previously existing levels even as you modify the vertical scale.
G. Typing text
Clicking on the  icon allows you to add text on the charts. Once the icon is pressed, you can click anywhere on the charts to type your text. A window will automatically open, allowing you to select the text's font, size, style and color. Click on Close to confirm your choice.
Bear in mind that you can modify the place in which the text is situated (refer to paragraph H) and the style options of the text (refer to paragraph J).
H. Moving an object
The  allows you to move an object or text displayed on your chart. After selecting the move icon, place your cursor on the object you want to move which will be shown In blue. Left-click on it and then left click again on the new location you want to move the object to.
I. Copying an object
The  icon represents two parallel lines. This button allows you to make a copy of any line, but also of any text element in your chart. Simply click on the object to copy and click anywhere else on the chart to paste the new object.
J. Changing the options of an object
The  icon allows you to change the options of an object, whether it be a text element or a line. Click on the object that you want to modify, and a window opens to let you modify the characteristics of this object: style, font, size and colour for text, width, colour, style and limits for lines.
K. Deleting an object
Click on this  icon first and then click on any object within your chart (text or line). The object will be deleted.
Note that the object turns to light blue when you approach it with the mouse cursor, indicating that you can already click with your left mouse button to delete it.
