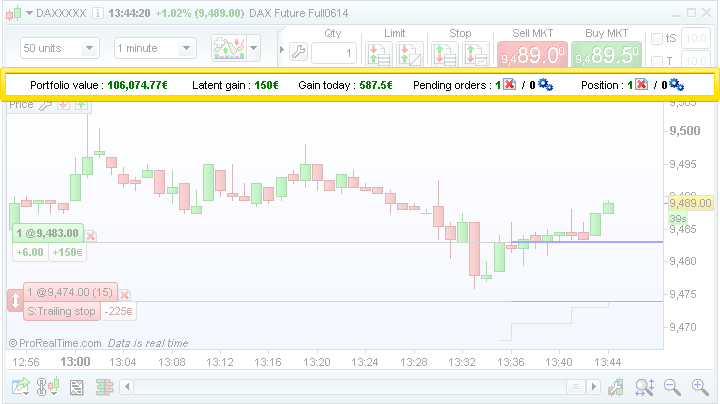
Order Display
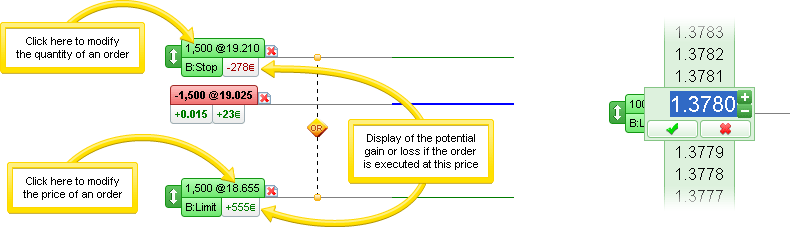
The improved order display on charts lets you:
- Easily modify the price or quantity of a pending order
- See the potential gain or loss if the target or stop level is reached
Trailing stops
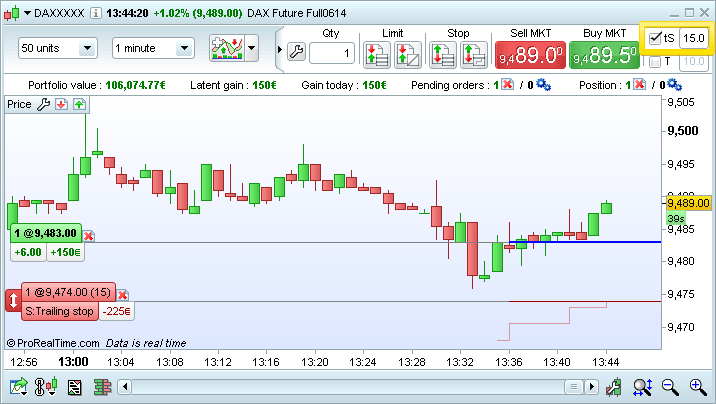
The quick access interface now lets you link trailing stops to a main order.
Learn more about trailing stops
Example of an order linked to a 15-point trailing stop
Order history on charts
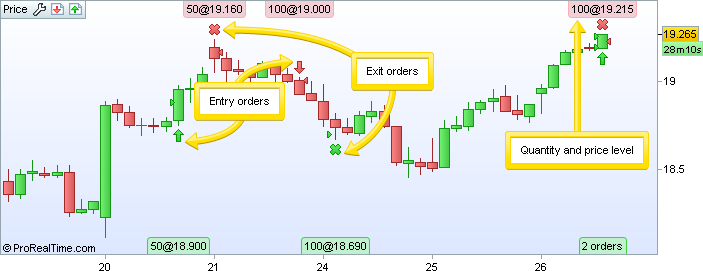
You can now view your recent executed orders on charts by adding the indicator "Recent executed orders".
- Entry orders are displayed with

- Exit orders are displayed with

- If several orders are displayed on a single bar, you can view a lower timeframe to see more details.
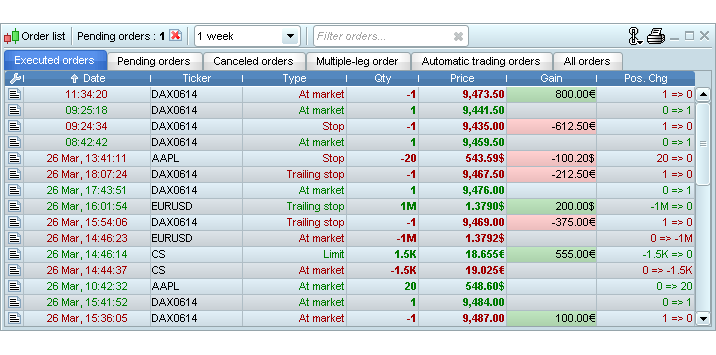
Order list
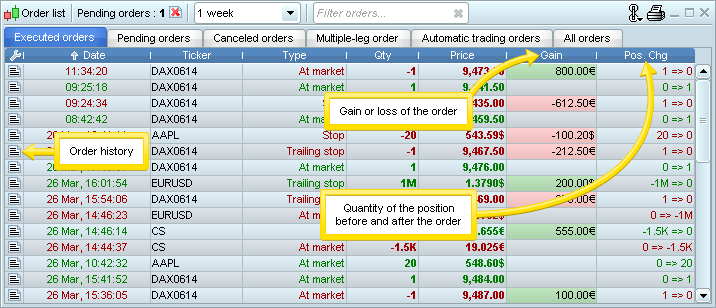
Two new columns have been added to the order list:
- Gain: shows the gain or loss generated by the order if applicable
- Pos. Chg : displays the quantity of the position before and after the order. For example, if you open a new position with 100 shares "Pos. Chg" will display "0=>100".
A search tool now lets you filter the order list to display only the orders of your choice. For example:
- Orders on a certain instrument or market
- Orders with a given quantity or price
- Orders of a certain type (market, limit, etc...)
Other trading improvements
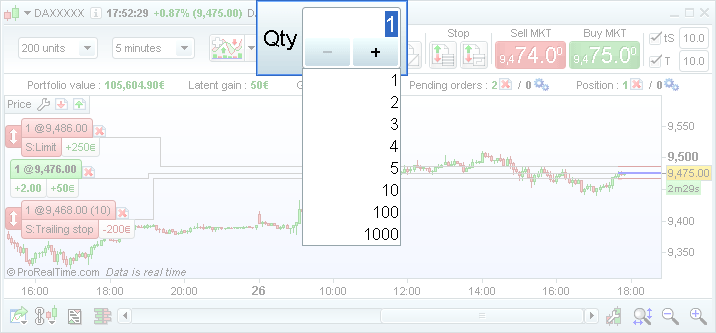
Order quantity entry
Gain time when entering your order quantity:
- Simply place your mouse over the quantity field and type the desired number (no need to click or select the quantity)
- + / - buttons and predefined quantities are also available
Display / hide positions and orders on charts
Positions and orders may be displayed on charts:
- All the time
or - Only when the trading interface is displayed
You can configure this option from the "Trading Options" > "Statistics & Order display" menu.
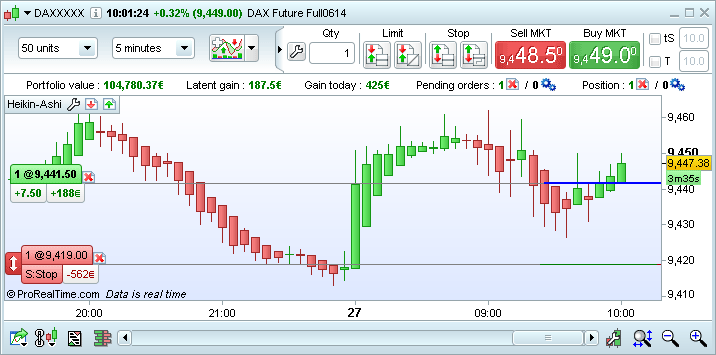
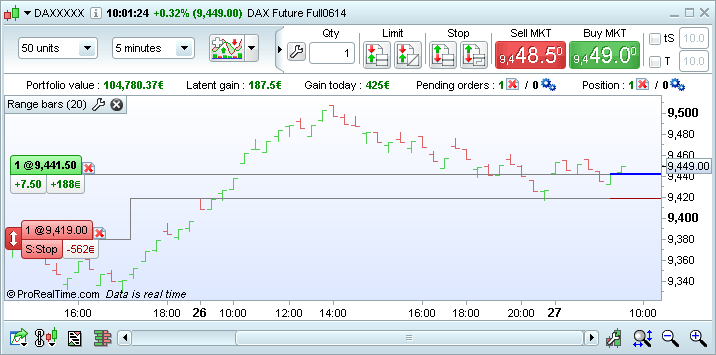
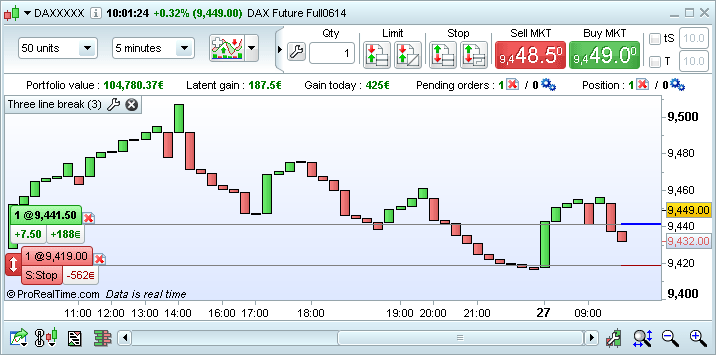
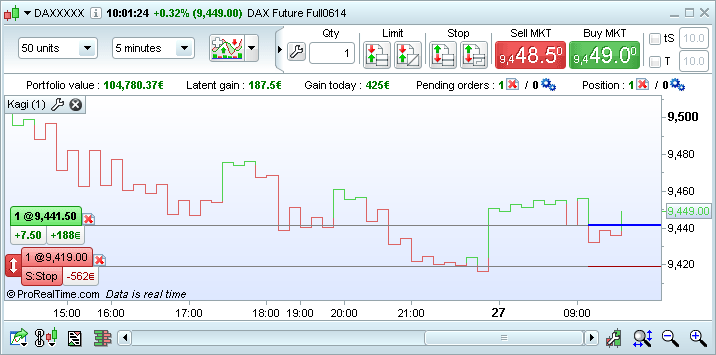
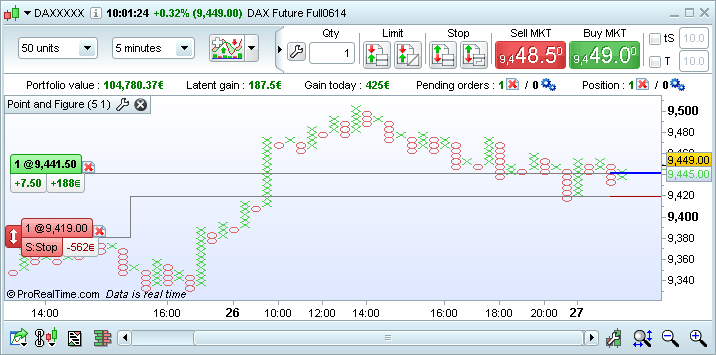
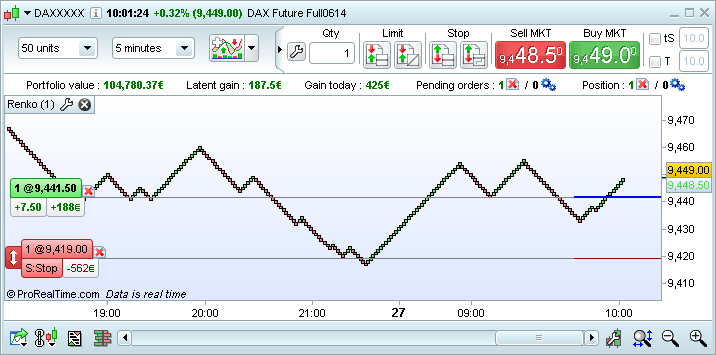
Order placement on all price styles
It is now possible to place and view orders on all price chart styles.
Heikin-Ashi
Range Bars
Three line break
Kagi
Point and Figure
Renko
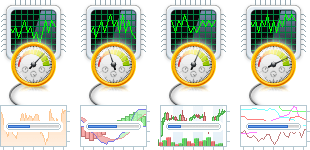
New indicators and objects
Six new indicators are available:
- Coppock Curve
- Know Sure Thing (KST)
- True Strength Index (TSI)
- Ultimate Oscillator
- Ulcer Index
- Vortex Indicator
Reminder : you can also create your own indicators by programming or import indicators created by third parties.
Two new drawing objects have also been added:
- Fibonacci channels
- Channels (free drawn)

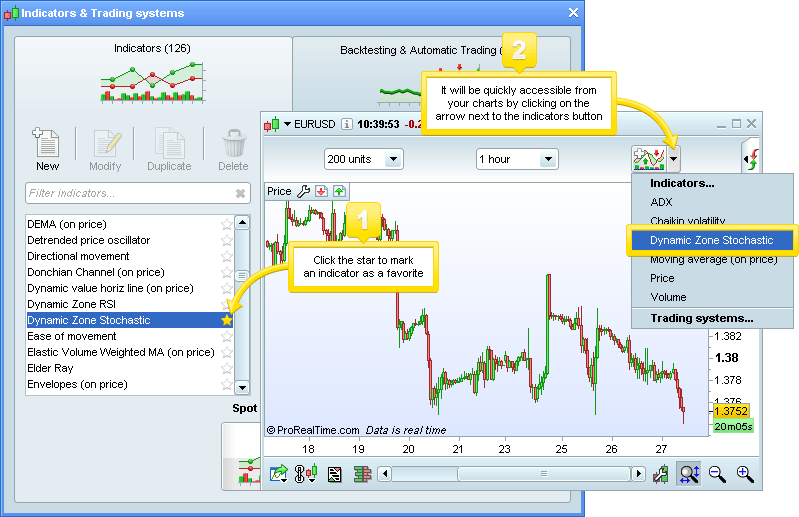
Favorite indicators
In the "Indicators ..." window, you can now choose favorite indicators.
Once an indicator has been marked as favorite, you can access it quickly from your charts.
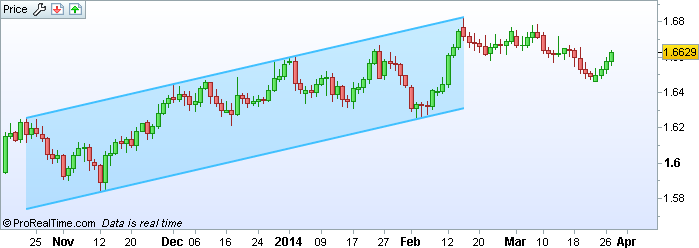
Color zones on objects
It is now possible to add color zones to both closed objects and open objects such as channels (free drawn channels, Raff, Fibonacci and standard error channels), Fibonacci retracements and expansions, and the ruler tool.
To add a color zone, right-click on an object to access its settings and choose the color. If you want the color zone to be always applied to objects of this type, choose "Set as default configuration".
New channel object with color zone
Quick instrument switch
The arrow in the upper-left corner of the charts lets you quickly change the instrument displayed.
You can directly click on a recently displayed instrument or enter an instrument name / ticker in the search bar.
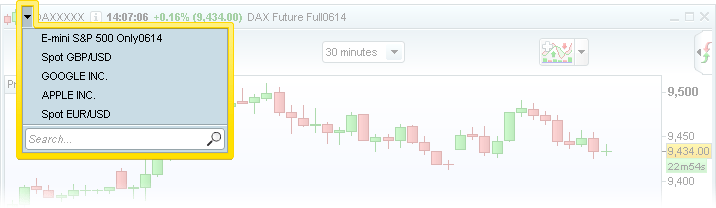
Quick instrument switch is also available for order books and tick by tick lists.
To change the instrument of all charts displayed, you can link them to each other.
Improved performance
Improving performance is something we are always working on to offer you a faster and more reliable platform. ProRealTime 10.2 offers:
- Improved performance and reliability of real-time data
- Quicker platform startup, especially for large templates
- Improvements to the servers the platform communicates with
Improved interface - Gain of screen space
ProRealTime 10.2 lets you gain screen space in several windows to let you display more content that is important to you.
Main window
The main window can now be displayed on two lines (instead of three previously).

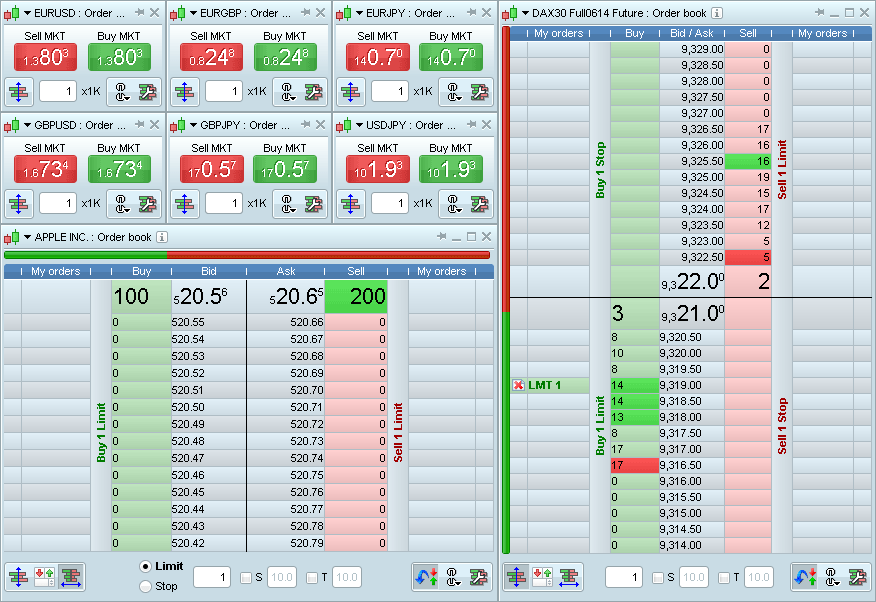
Improved Order Book
The vertical order book can now display more lines in a window of the same size.
The best bid/ask view order books (mainly used for forex) have also been improved.
Gain of screen space in other windows
Several other windows have also been redesigned to gain vertical space.
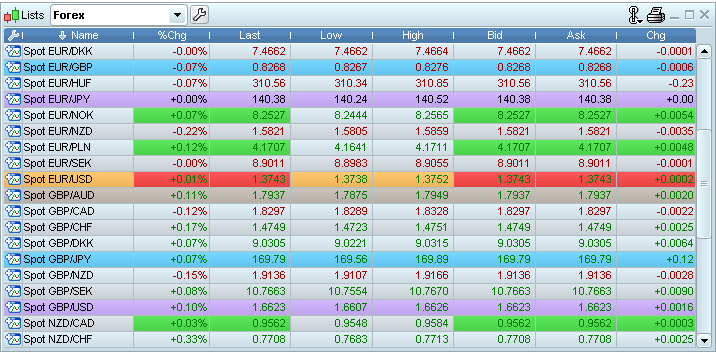
Lists
Order list
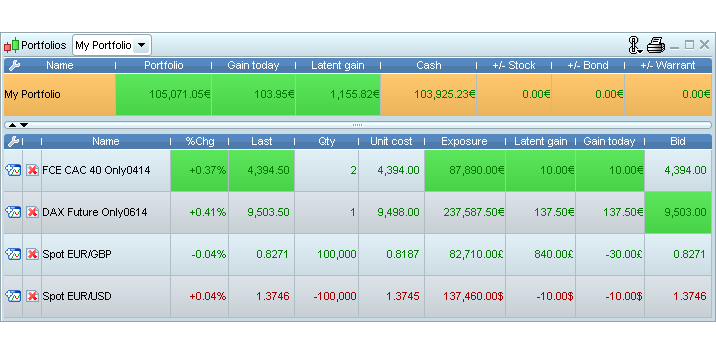
Portfolios
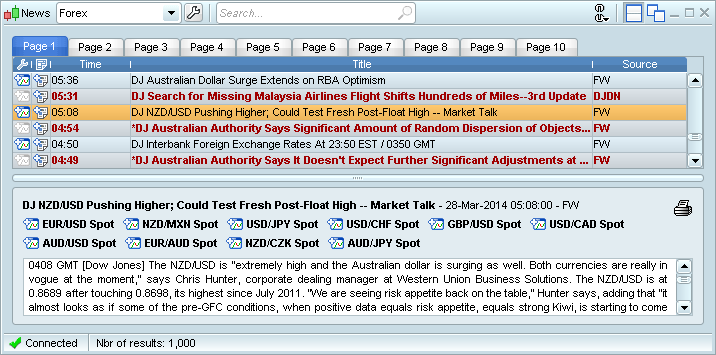
News window
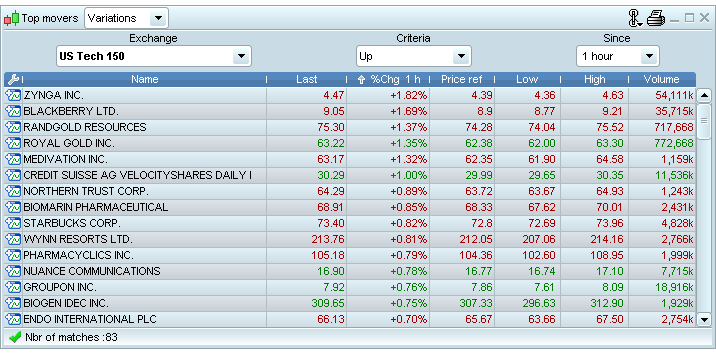
Top Movers
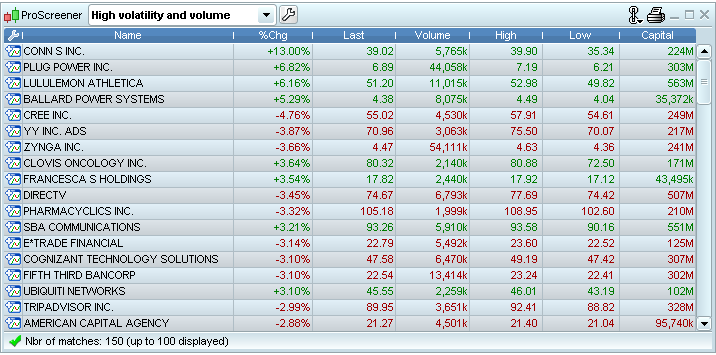
ProScreener
Trading information on charts
Trading information displayed at the top of charts has been compacted to save more than 50% of vertical space.
It is also possible to hide some or all of this information from the menu "Trading options" > "Statistics & Order display".
Improved interface - Save time
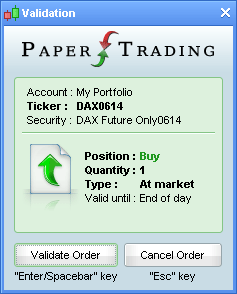
Validate popups with keyboard shortcuts
ProRealTime v10.1 already let you confirm or cancel orders with the "Enter" or "Esc" keys of the keyboard to save time.
ProRealTime 10.2 applies this method of confirmation to additional messages and popups of the platform.
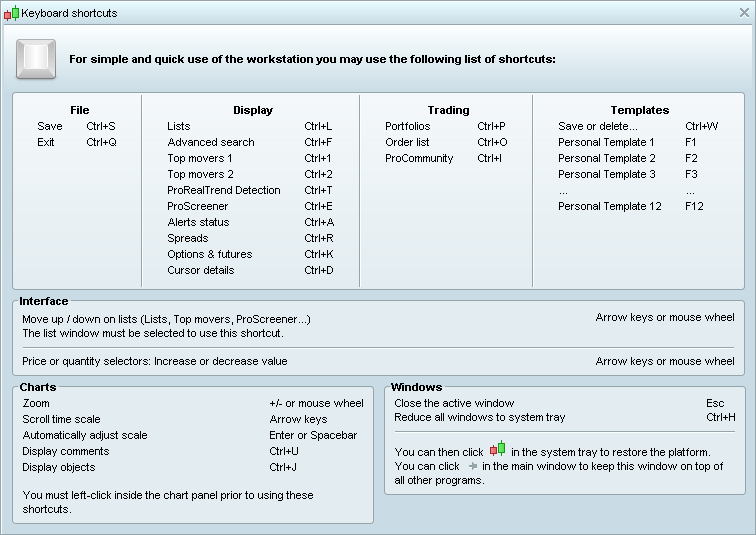
New keyboard shortcuts
New keyboard shortcuts are available.
From the "Help" menu, you can now see the following list of keyboard shortcuts:
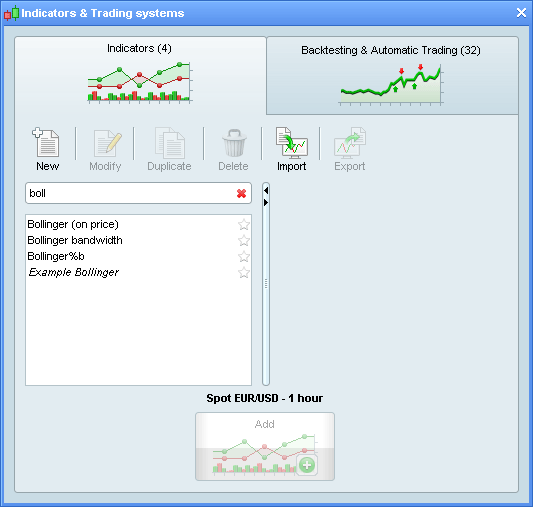
Quick search for indicators, trading systems & screeners
A quick search tool is available in the indicators, trading systems, and ProScreener windows to help you quickly find what you are looking for.
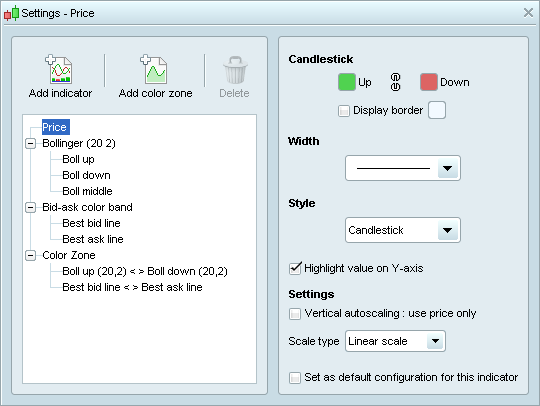
Improved Indicator properties
The indicator properties window has been redesigned.
The lines which compose each indicator are now displayed as attached to each indicator for a clearer display.
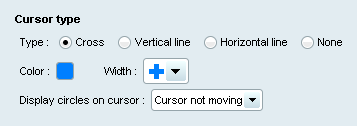
Cursor customization
You can now customize your cursor by choosing its color, thickness and type via the "Template Options" > "General" menu.
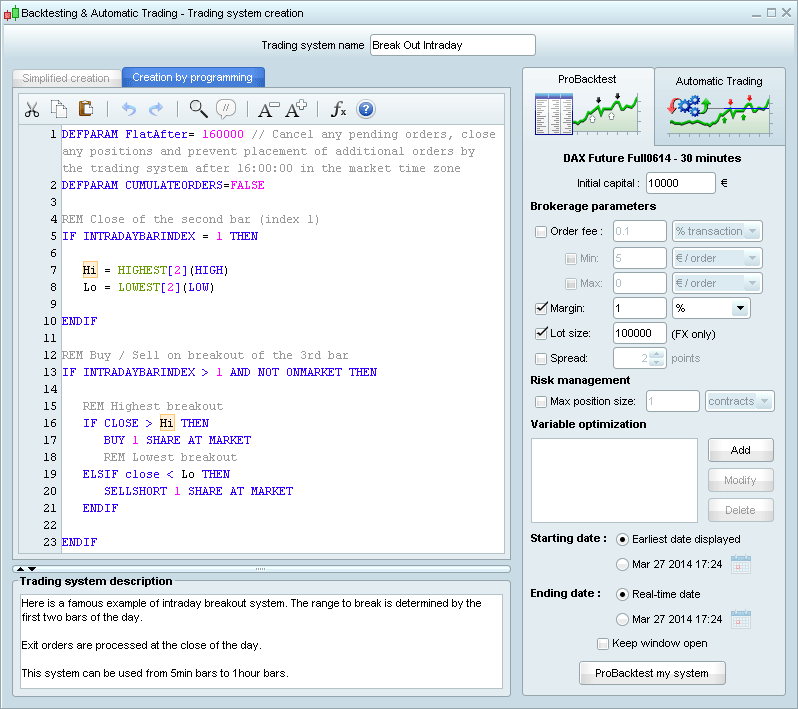
Programming
New ProBacktest functions
The management of server-side backtests has been further optimized. New instructions are also available (see ProBacktest manual for more details), including :
- Graph lets you chart variables that you use in your trading systems.
- FlatBefore=HHMMSS and FlatAfter=HHMMSS let make a trading system exit positions and prevent any order before/after a specific time of day.
- StrategyProfit[n] indicates the gains or losses of the system at the time of the close of the nth previous bar.
Code editor
A toolbar has been added to the code editor allowing you to:
-
 Cut (Ctrl + X),
  copy (Ctrl + C),
  paste (Ctrl + V)
-
 Undo last action (Ctrl + Z) /
  Redo last action (Ctrl + Y)
- New Find/Replace feature in code editing windows: press Ctrl + F to access it.
-
 Comment / Un-comment a line of code (Ctrl + R)
-
 Increase /
  Decrease text size
-
 Insert functions and view function help
-
 View the programming manual
When you select a variable, the code editor now highlights all occurrences of this variable in the entire code as shown below.
Other improvements
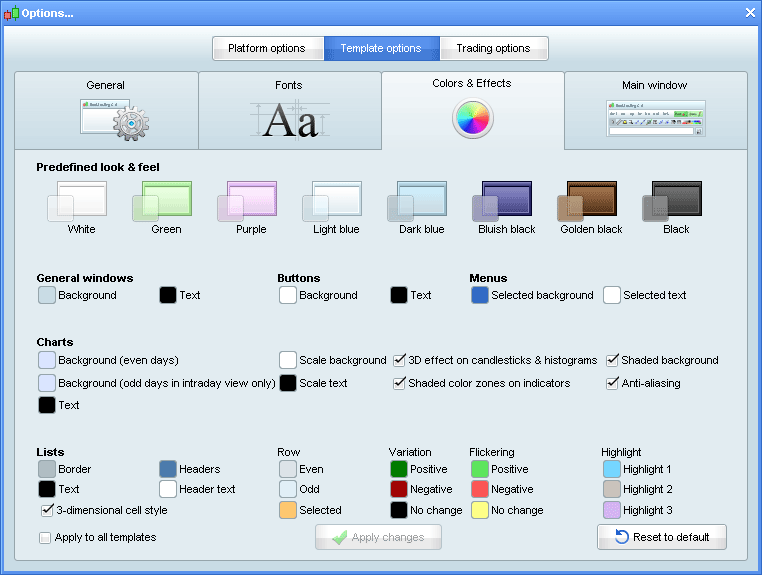
Options menu
Options and settings have been reorganized in a window which is divided into three parts:
- General options and trading options apply to the entire platform
- Template options can be customized independently for each template or applied to all templates
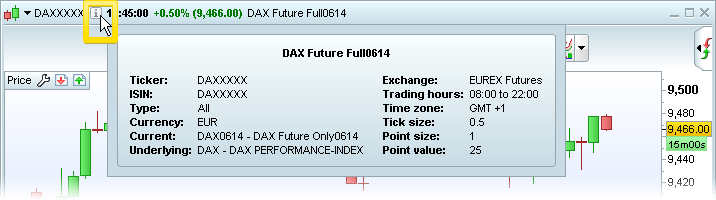
Instrument information
By placing your mouse over the new ![]() icon displayed at the top of each chart or order book, you can access important information about the instrument in the chart:
icon displayed at the top of each chart or order book, you can access important information about the instrument in the chart:
Cursor details on chart
Display of cursor details on charts has been improved. Information about each element is displayed in a separate and clearly identified box:
Other improvements
- Variations are now colored in titles of chart windows
- Possibility to "pin" the order book window so that it is always on top
- Improvements to groups of charts (Premium version only)