Improved order placement
Create OCO order contextually from positions
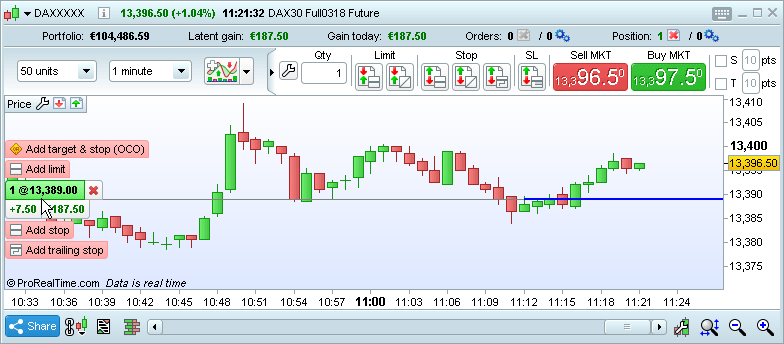
To add a linked OCO order (profit target and stop loss order), hover over a position with your mouse, then place the order on the chart.
New ways to modify orders
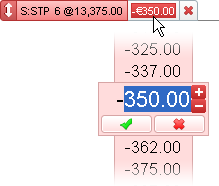
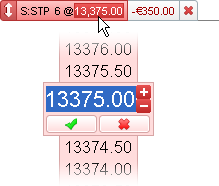
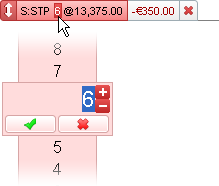
Orders can now be easily updated directly from the order tab on the chart.
CHANGE DESIRED GAIN OR LOSS (STOPS & TARGETS)
CHANGE PRICE
CHANGE QUANTITY
New ways to set order size depending on the instrument type
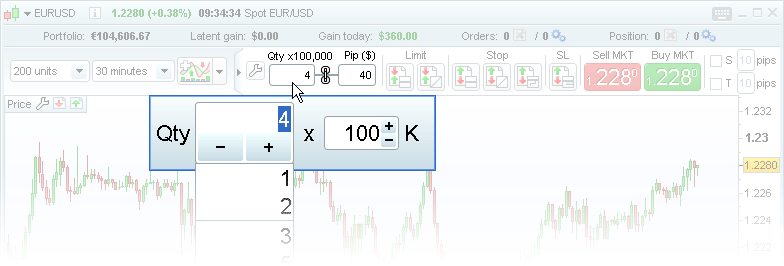
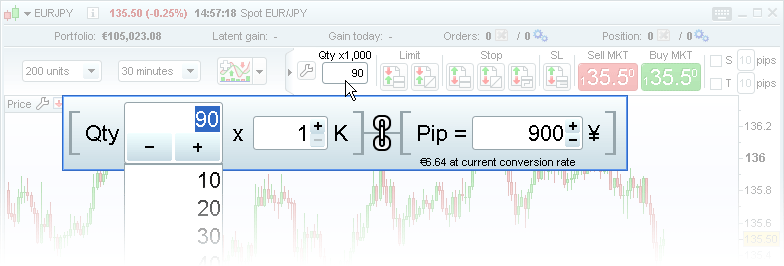
- Forex: Specify order quantity by pip value or order size
Examples:
If I set for the instrument EUR/USD 1 pip = 4 USD, the software will automatically adjust the order quantity to 40x1K
If I set for the instrument EUR/JPY an order size of 90x1K, the software will display the pip value 1 pip = 900 JPY for that order size
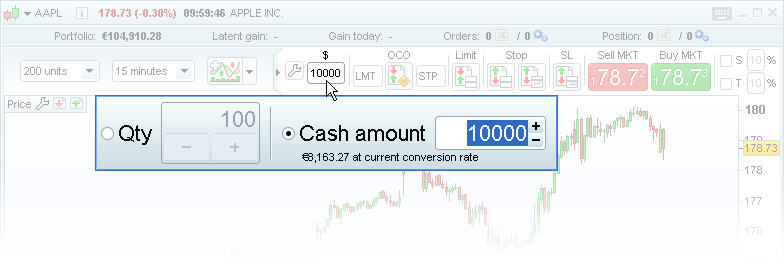
- Equities: Choose order quantity by position specifying your desired position value (exposure)
Examples:
If I want to buy stock of apple, I can set the desired value of the order (ex: 10 000 USD) and the software will automatically calculate the quantity of my order!
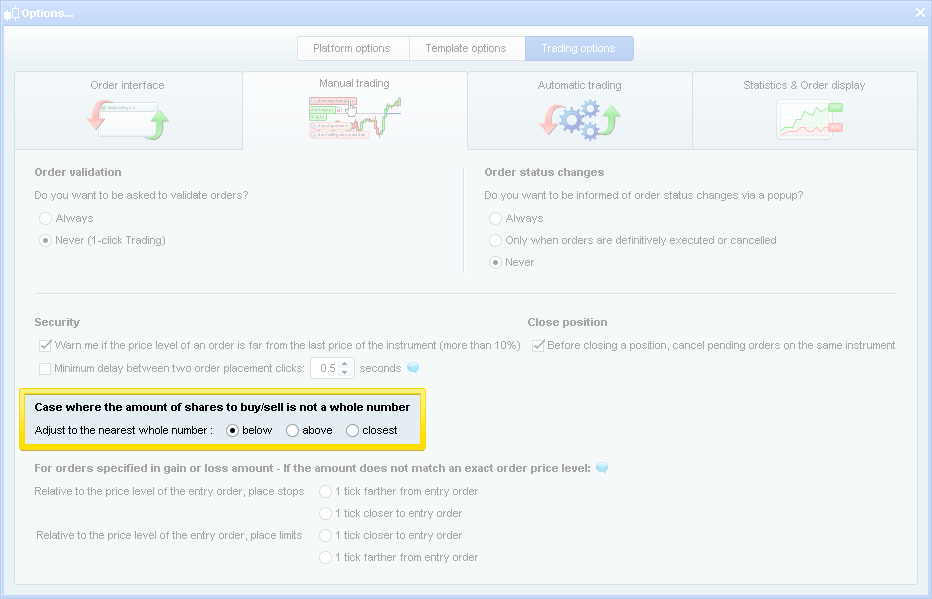
You can choose in the trading options window how you want to handle the case where your specified order value does not correspond to an exact number of stocks:
These new methods of order quantity definition are available everywhere you can set order size in the platform (chart order bar, order book, etc...)
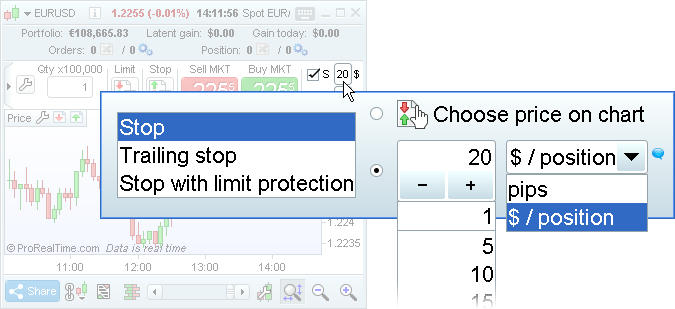
New ways to place Targets & stops
- For Stocks: cash per position, cash per share,%, choose price on chart
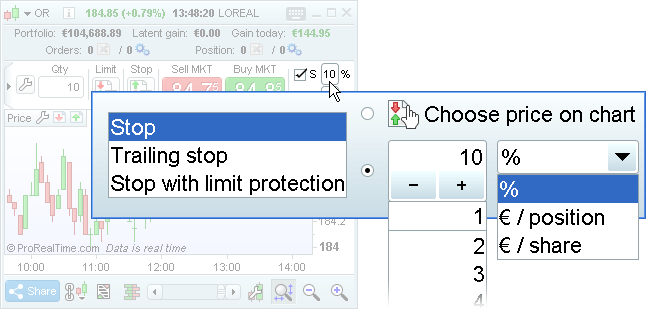
- For Forex: cash per position, pips, choose price on chart
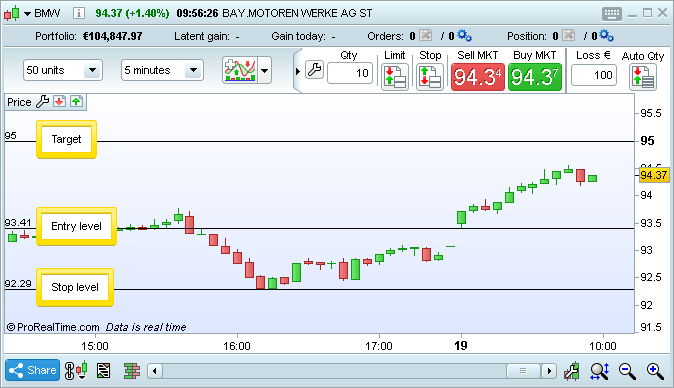
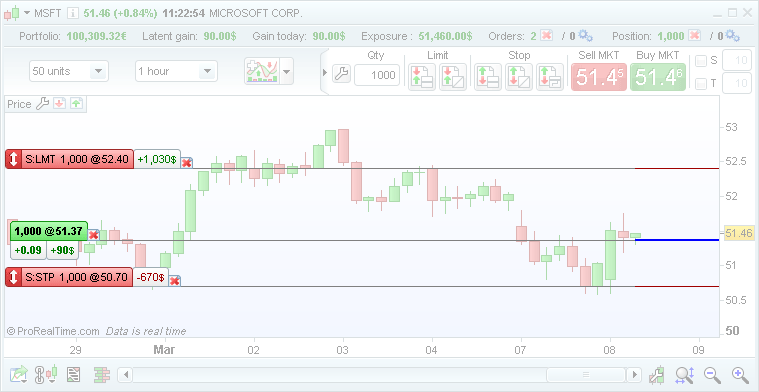
Automatic quantity orders
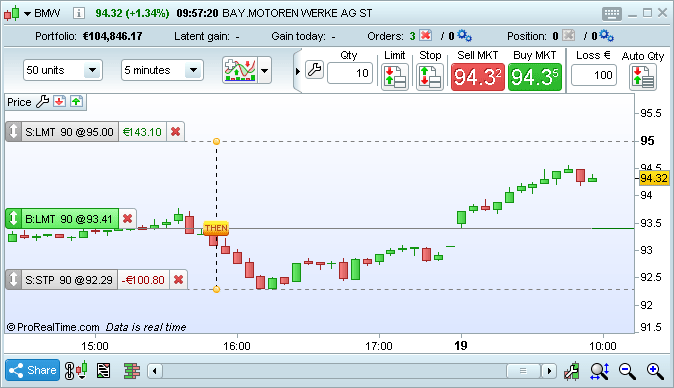
This new order type sets the quantity of your order based on your desired gain or loss at any price level.
Example:
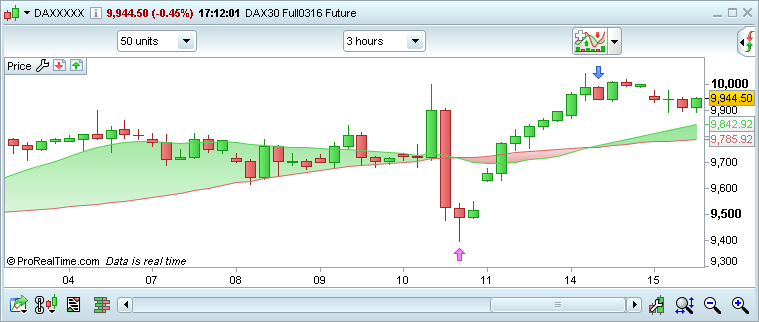
- I want to create an order to enter the market at the levels in the image below and create a stop order and target order based on support and resistance lines I have drawn (stop loss and profit target)
- I want to risk at most 100 € on this position
- The software can now create an order for me with its quantity automatically determined by a loss amount I specify (stop loss order) or a gain amount I specify (target order)
- In the automatic quantity order tab, I specify the loss of 100 €
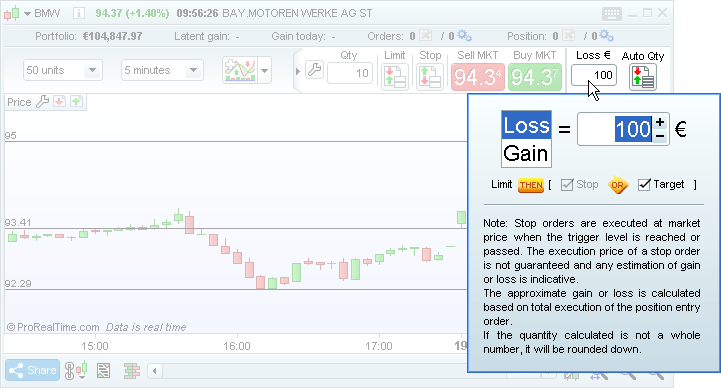
- The software automatically sets my order quantity based on price levels of my orders to generate a stop loss with amount closest to the amount I specified.
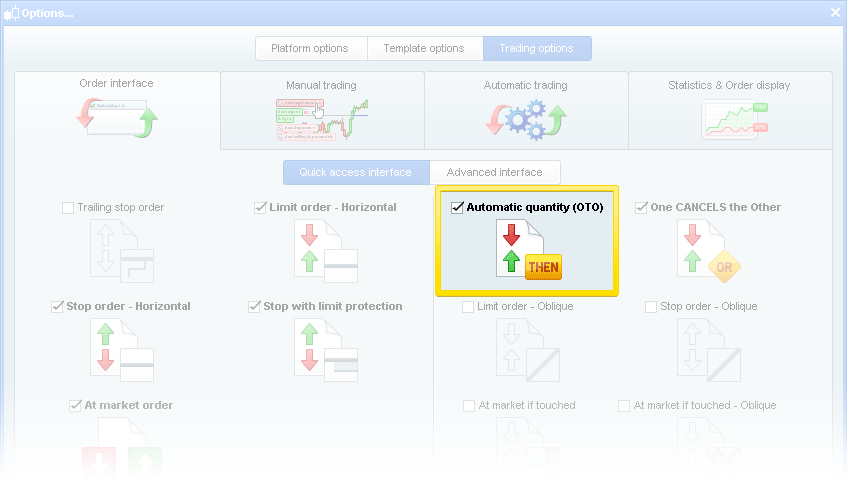
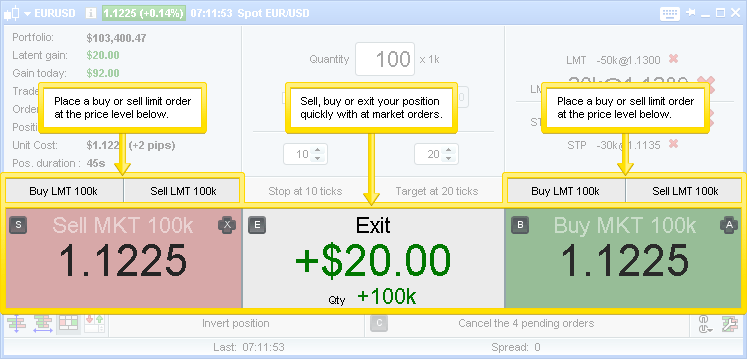
- Automatic quantity orders can be enabled from the quick order interface:
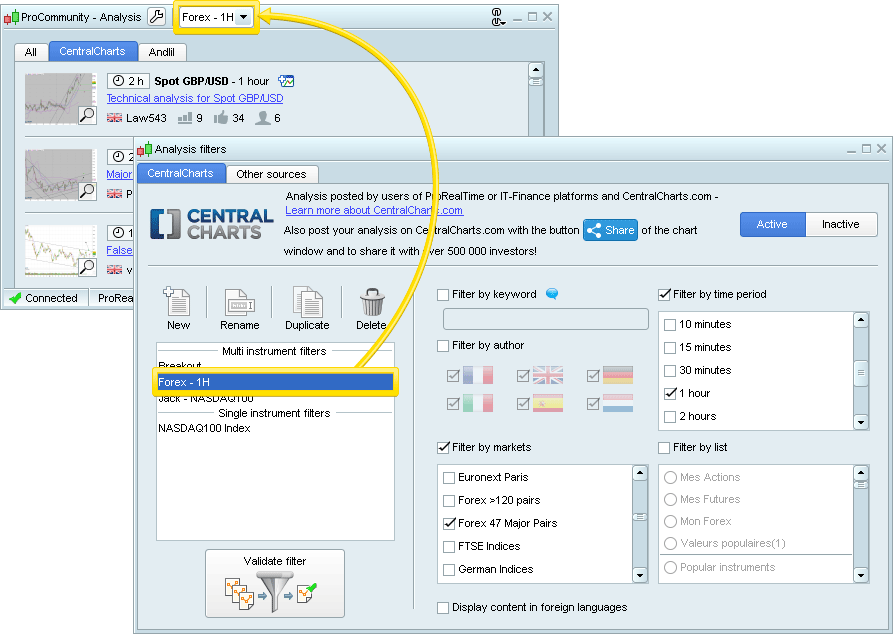
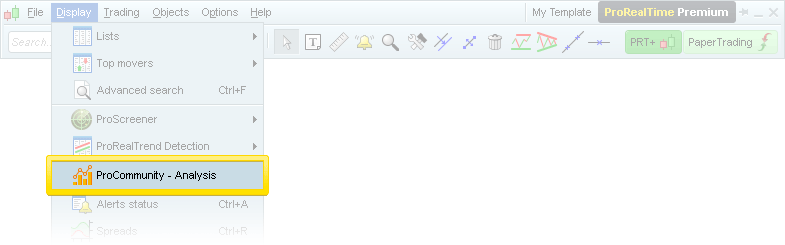
ProCommunity Analysis
View CentralCharts and Andlil Analysis on a wide variety of instruments
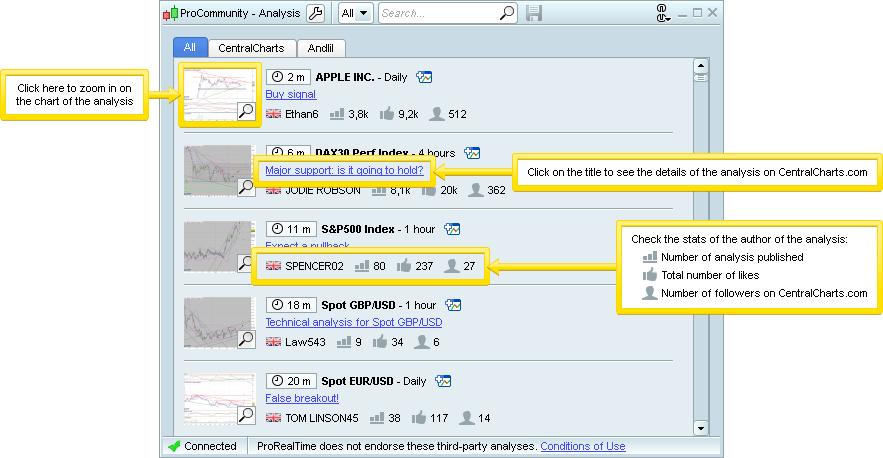
Check the quality of the analysis on CentralCharts.com
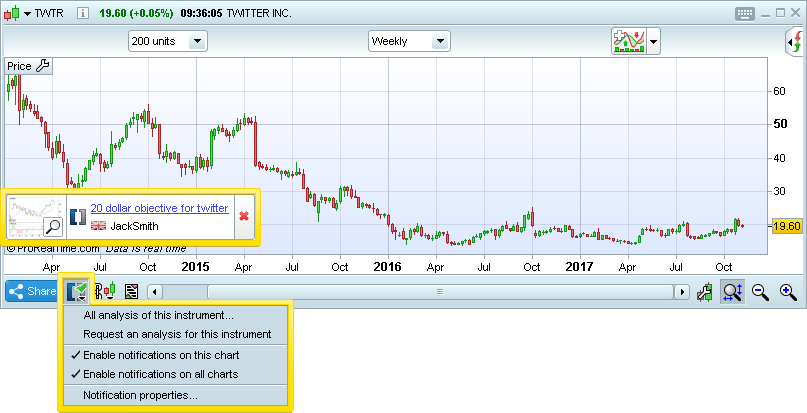
Get real-time alerts on your charts when a new analysis is available
Quickly find analyses that interest you most filters on market,
instrument, author, timeframe or keywords
Gain visibility for your own analyses on ProRealTime,
CentralCharts and Social Media
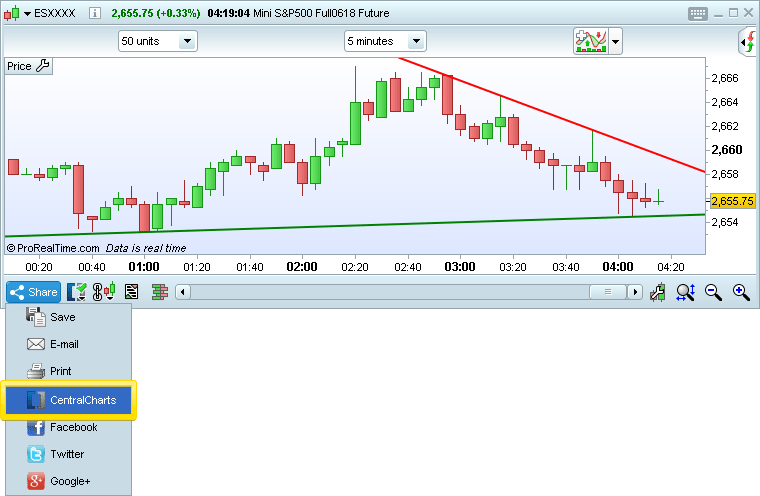
- Use this button to share your analysis with over 500,000 community members on CentralCharts and ProRealTime
- You can also link your CentralCharts account to X (Twitter) to share automatically on ProRealTime and on X (Twitter)!
Start using ProCommunity Analysis to get access to these benefits
Content providers for ProCommunity Analysis :
- CentralCharts.com is a trading social network and information website about financial markets for traders and investors. Analysis of users can be viewed in ProRealTime and you can also share your own analysis!
- Andlil.com is a trading website by Benoist Rousseau, a proprietary trader specialized in scalping. Articles and video recaps of his trading week are available in several languages.
See conditions of use of the ProCommunity Analysis in the ProRealTime platform.
Information in the ProCommunity Analysis module is provided by users of CentralCharts.com and Andlil.com. ProRealTime does not endorse these websites which are managed by third party companies and governed by their own terms of use.
Improved performance
- Major server-side upgrades and improvements to accelerate datafeed speed even more and redure latency in high volatility markets. Check and compare!
- Several platform-side optimizations to improve draw speed of price and indicators in the platform
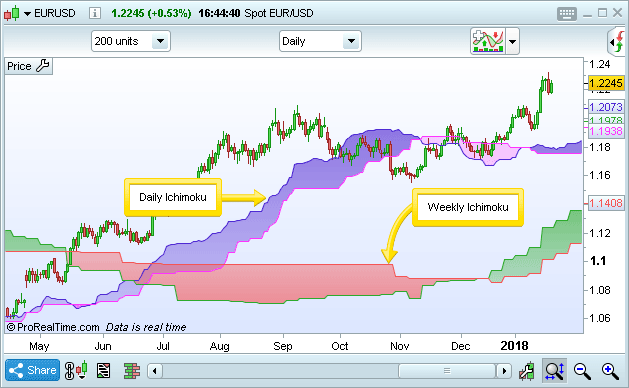
Ichimoku improvements
- You can now customize the time period of Ichimoku indicators displayed on any chart
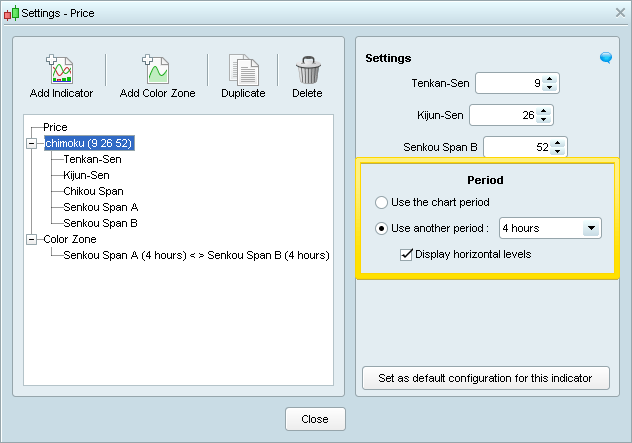
- You can also add multiple Ichimoku timeframes to a single chart
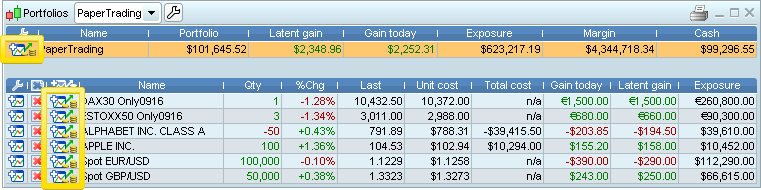
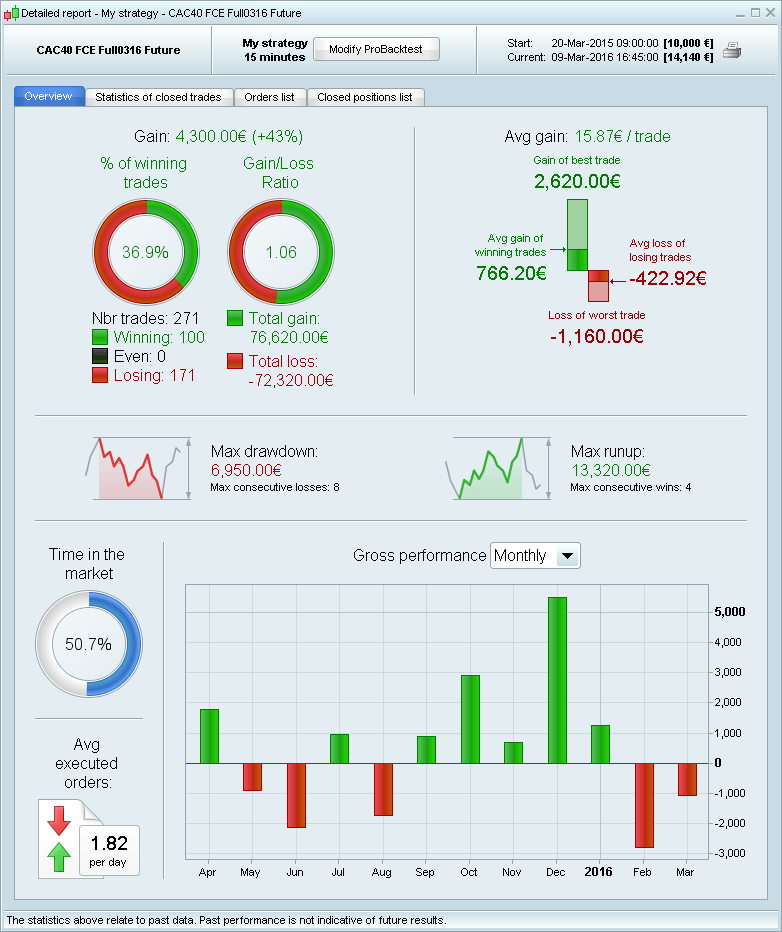
Detailed report on your trading
- You can now generate a detailed performance report on your real trading activity, including manual trading, automatic trading, or all trading
- Reports can also be generated based on PaperTrading
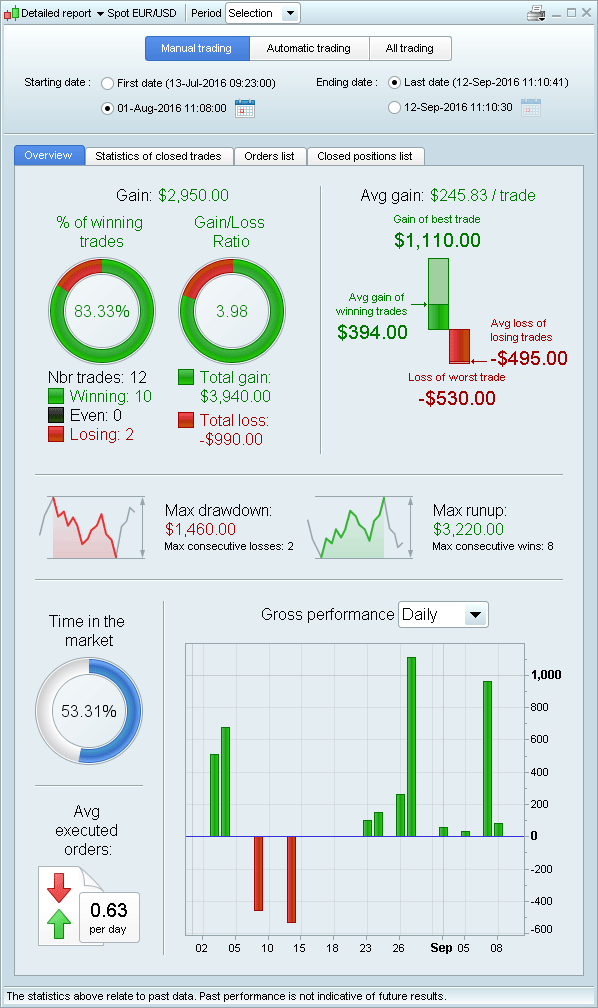
- To generate this report, open your portfolio window and click the detailed report icon (to the right of the red X in the image below)
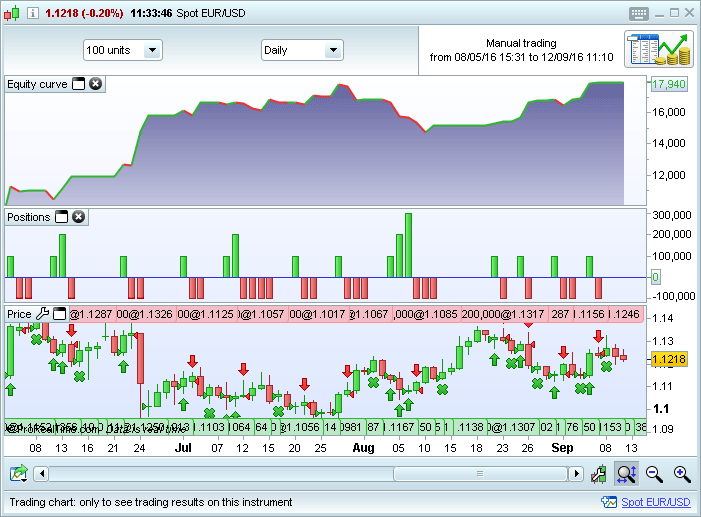
- A trading chart will also display your trades and equity curve for the chosen instrument
Order book scalping mode
A new "scalping mode" has been added to the order book. Scalping mode is made up of several large buttons and associated keyboard shortcuts to simplify trading.
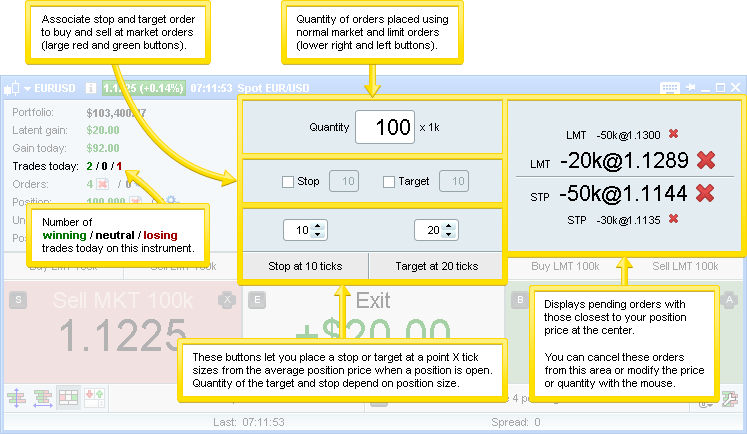
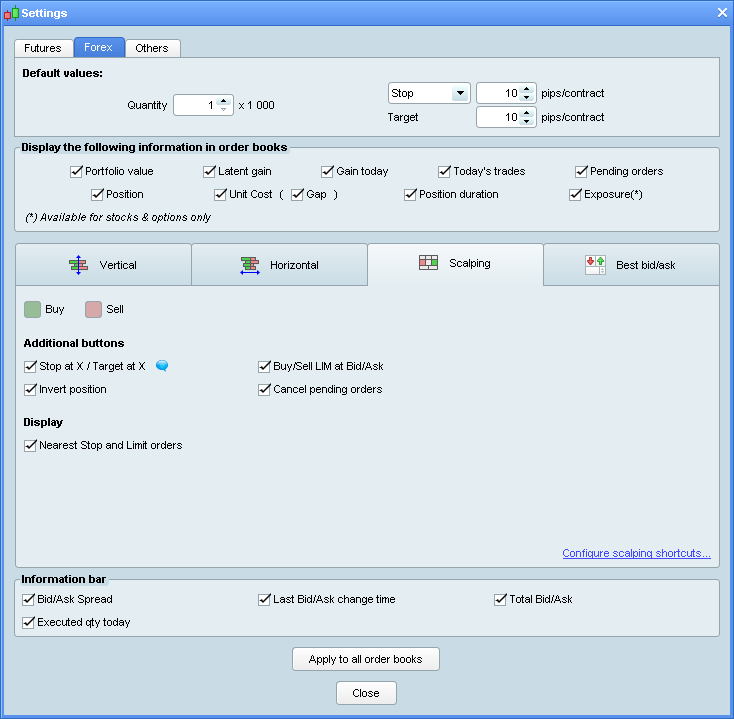
- The scalping mode order book options are completely customizable (like other order book modes)
- To configure scalping mode, click the wrench button in the lower right to open the options window shown below.
Trading interface
The quick acces interface has been redone and new order types were added that were previously only available in the advanced interface :
- Stop with limit protection
- One cancels the other
- At market if touched
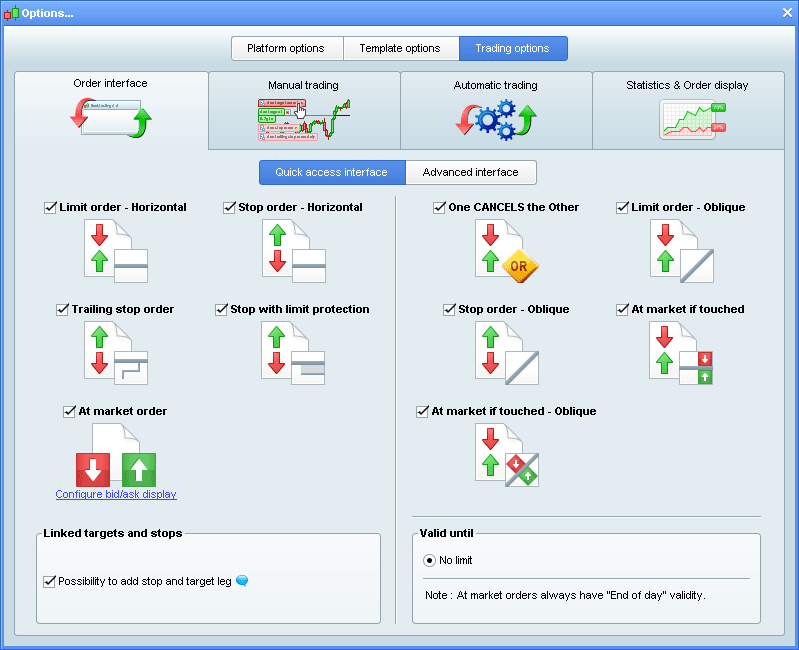
- The trading interface now lets you link target and stop orders to all of the order types on the left side of the window (Horizontal Limit, Horizontal Stop, Trailing stop, Stop with limit protection, at market)
- Linked stop orders can be standard stops, stop with limit protection, or trailing stops
- Many new keyboard shortcuts are now available for trading
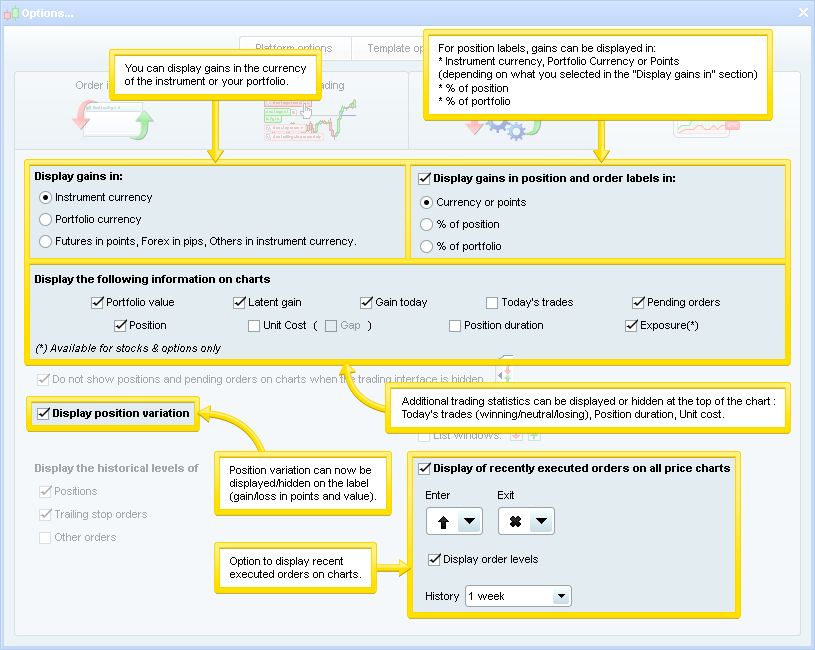
Statistics and order display improvements (in the "Trading options" window)
Other trading improvements:
- The height of order tabs has been reduced to make them easier to read
- Detailed report and statistics for your recent executed orders accessible from the portfolio window
- Buy/Sell colors can now be globally customized (ex: blue/red or green/red) from the "Colors" tab in "Options" > "Template options".
- Closed positions now appear greyed out in the positions window
- At market orders that have not yet been confirmed (or executed) will now be shown in grey on the chart. Unexecuted at market orders placed when the market is closed can be cancelled more easily.
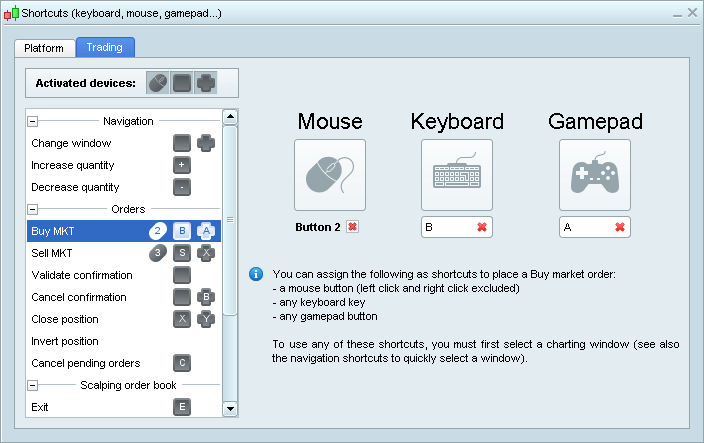
Keyboard, mouse and gamepad shortcuts
- A new shortcuts window is available - it lets you customize shortcuts for using the platform and for trading
- ProRealTime can now use game pads as an input device
- A single function can have shortcuts assigned on multiple different devices (mouse, keyboard and game pad).
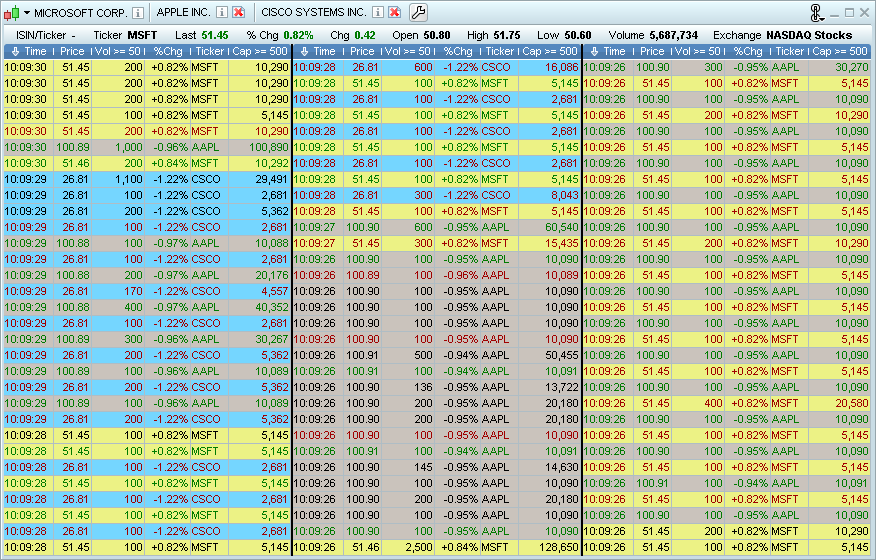
Multi-instrument ticker
- New multi-instrument ticker mode with multiple columns (fullscreen mode available)
- Add instruments to tick by tick lists with drag and drop from other lists or by clicking on the "wrench" in the title bar; click the red cross in the title bar to delete instruments
- New "capital" column = volume*price of the tick
- New filters in the settings window to only display ticks with a chosen minimum volume or capital
- You can load more tick by tick history when only one instrument is displayed
Objects
The following new objects have been added to the platform:
Oblique rectangle and oblique ellipse
Fibonacci Ellipse
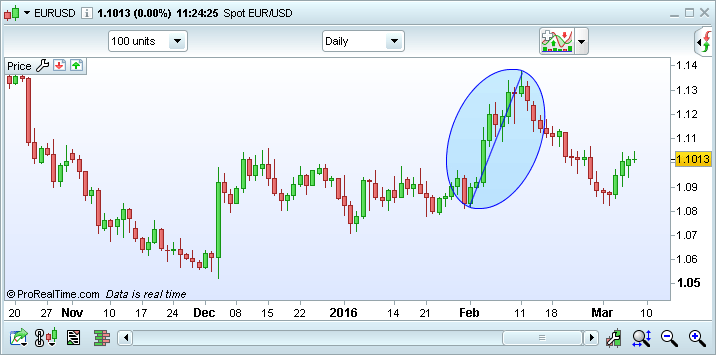
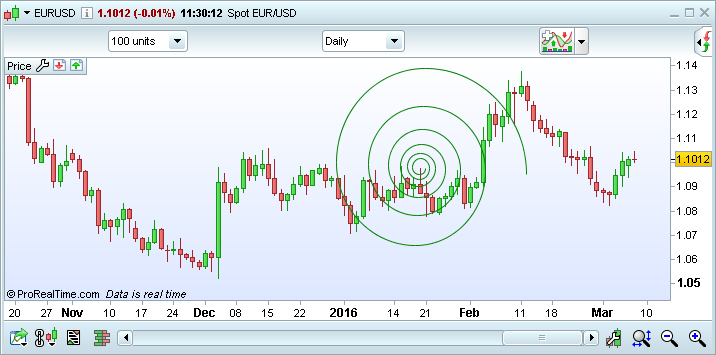
Fibonacci Spiral
- Fibonacci Ellipse - The height/length ratio of a Fibonacci Ellipse is always the golden ratio.
- Fibonacci Spiral - Fibonacci Spirals have 6 rotations. Each rotation size is determined by multiplying the previous size by the golden ratio.
- Gann Square - the Gann Square is drawn by setting 2 opposite diagonal points of the square. Internal lines may show support and resistance.
- Gann Grid - A Gann Grid is made up of parallel lines forming a grid based on an initial trend line drawn.
- Improved Text Object - possibility to link text to a point, display price and date, view on mouse hover only, angle texts.
- Schiff pitchfork - The Schiff pitchfork is similar to an Andrews pitchfork. Its origin is located at 1/2 the vertical distance and 1/2 the horizontal distance between the high and low points (first two points set). A Schiff pitchfork is created by first drawing a trend line between two extreme points. A third point is then set either above or below the second point. The lines of the pitchfork can be used to show a trend.
Drawing object improvements :
- Additional optional levels added to fibonacci arcs and fans
- Objects other than lines can also be transferred to inferior time units from the "Options" / "Platform options" menu
- Line transfer points can now be displayed on other time units
- Additional objects support color zones (filled in colors)
Indicators
New indicators
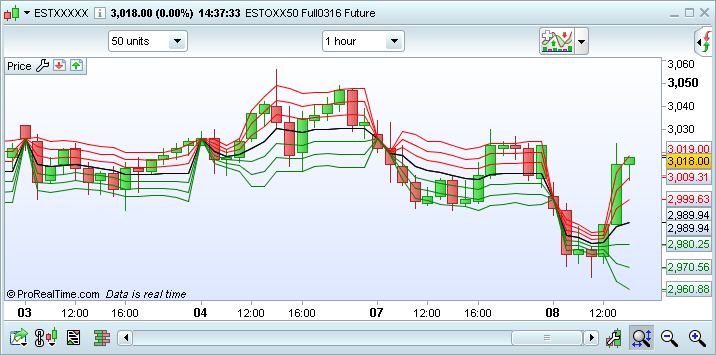
- VWAP and VWAP bands - VWAP is the volume weighted average price. VWAP bands are calculated by applying a standard deviation (similar to Bollinger bands).
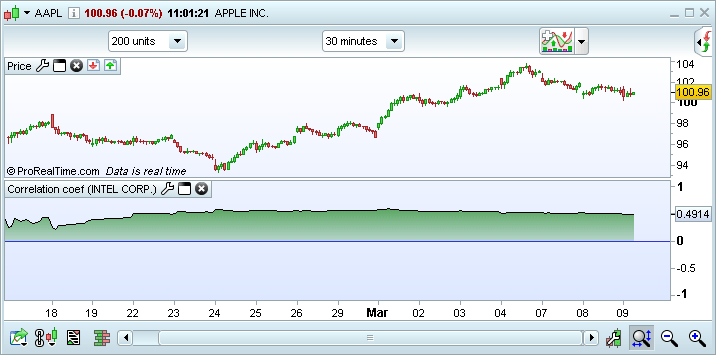
- Correlation coefficient indicator - measures the correlation in price between 2 instruments. A correlation close to 1 shows a very strong correlation.
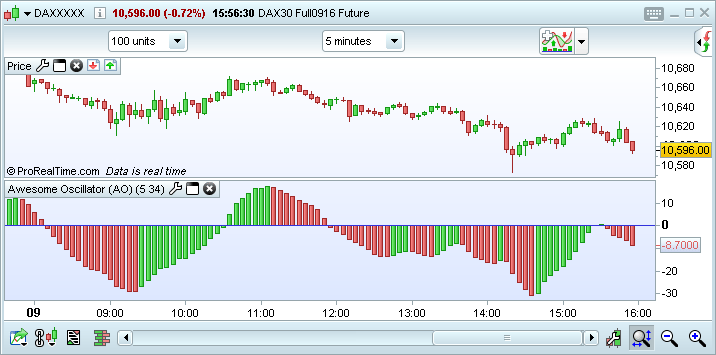
- Awesome oscillator - a momentum oscillator that the difference between a long simple moving average of the median price and a short simple moving average of the median price.
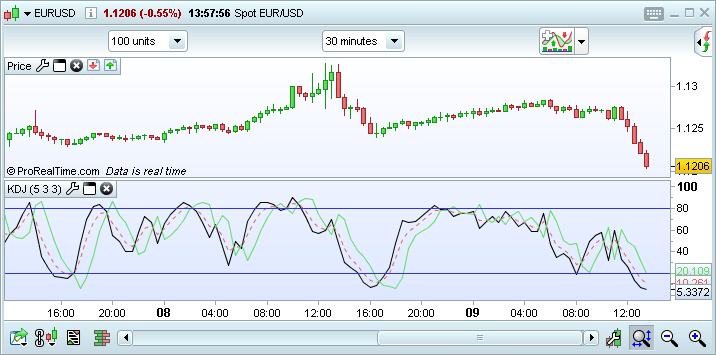
- KDJ - a stochastic indicator with an additional line "J" which shows divergence.
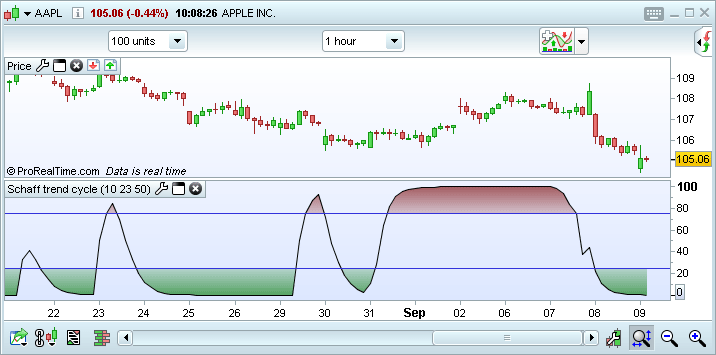
- Schaff trend - Schaff trend cycle is an oscillator combinies Slow Stochastics and the Moving Average Convergence/Divergence (MACD).
Indicator improvements
- Any indicator can now be added from the indicator properties chart window
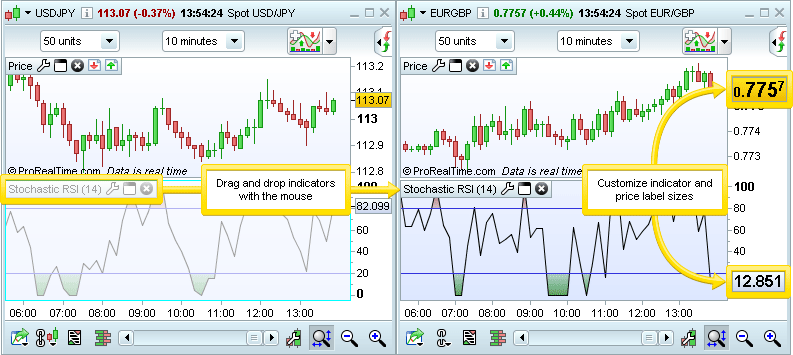
- Indicators can now be dragged and dropped between different charts
- Price and indicator labels now have customizable sizes
- Customizable time periods and time zones for pivot points
Lists
- Improved list creation and management : easily copy instruments from one list to another
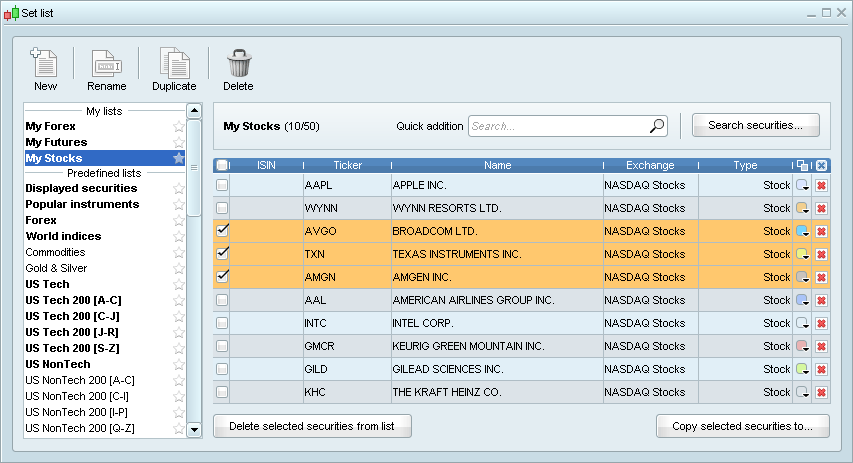
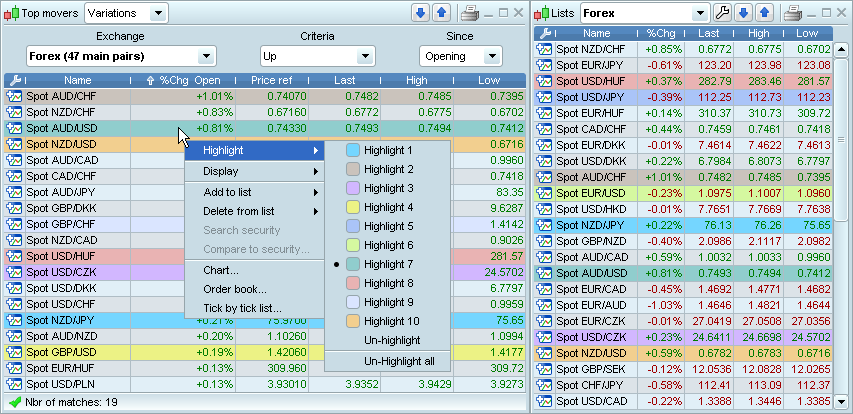
- Improved highlighting in lists and you can now use 10 different highlight colors at once
- Selected instruments are highlighted across all lists including orders, portfolios, screeners, top movers, etc
- Arrow buttons added in list headers to easily move up and down.
- Lists and screeners will now remain in front after clicking on them to open charts.
Alerts
- Human voice available to announce order executions and alerts triggered (ex "Buy at market executed" ; "Alert triggered - sell")
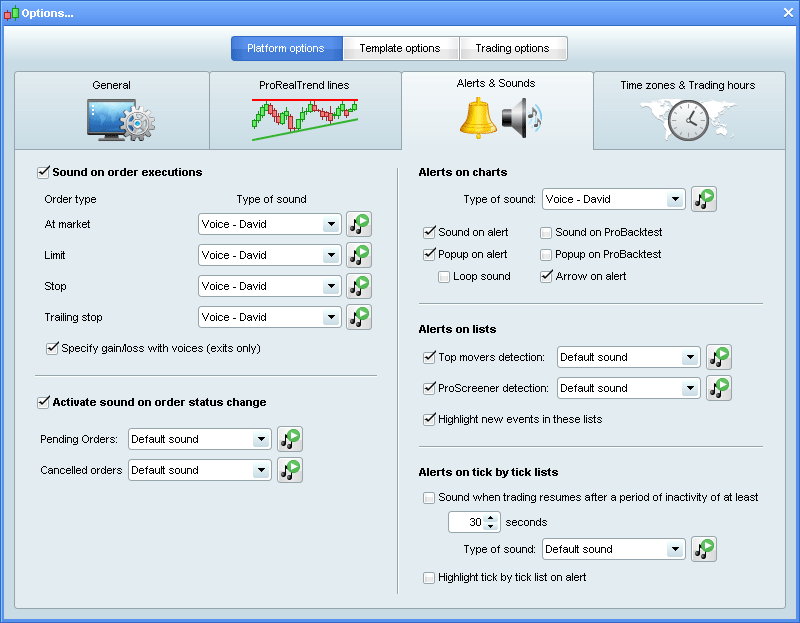
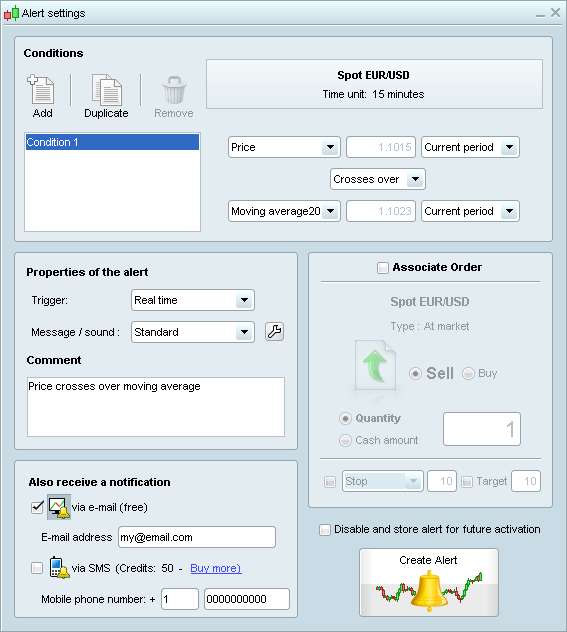
- New alerts window
- Free e-mail alerts in addition to the previous SMS alerts
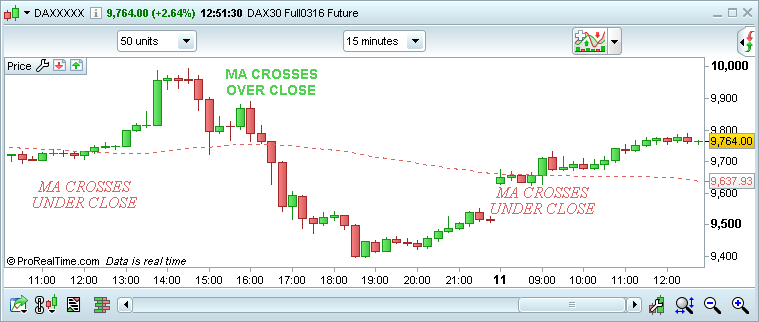
- More alert conditions (ex: crosses over and crosses under)
Saving system
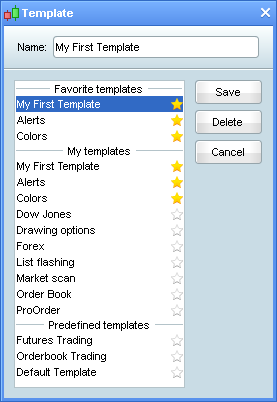
Saving your work is now simpler: in v10.3 all of your data is saved whenever you save a template.
In the "File" menu, select :
- "Load template" to load a workspace
- "Save" to save your current template
- "Save as..." to save a new template
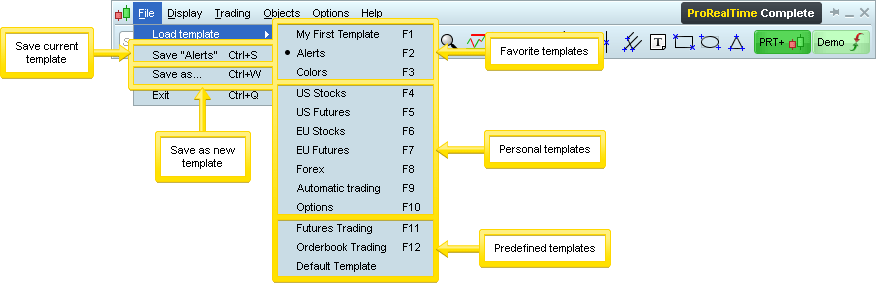
You can now make "favorite templates" which will appear above all of the others.
Backtesting and detailed report
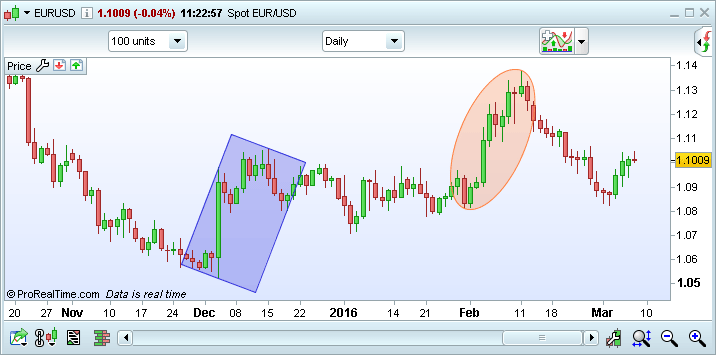
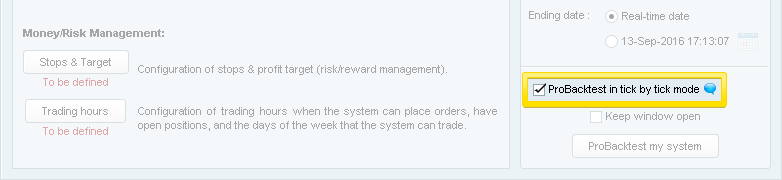
Tick by tick backtesting mode
- ProBacktest now includes a tick by tick simulation mode to generate results as close as possible to real-time execution during the simulated period.
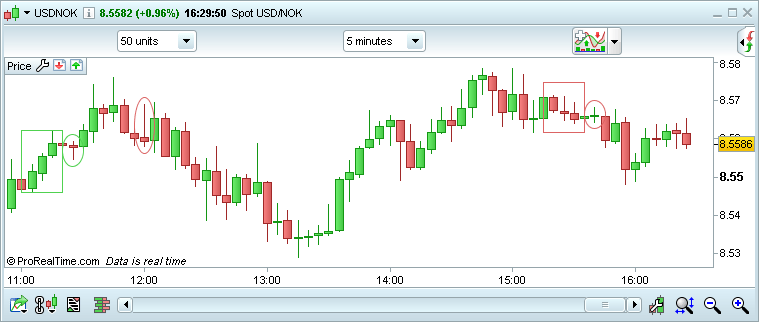
- Backtesting with tick by tick data lets the system determine the sequence of execution if several orders are triggered by your trading system in a single candlestick.
- For example, if the system generates both a stop and a limit order which can potentially be touched in the same candle (as shown in the image), the backtest will use tick by tick data to determine which order should be executed.
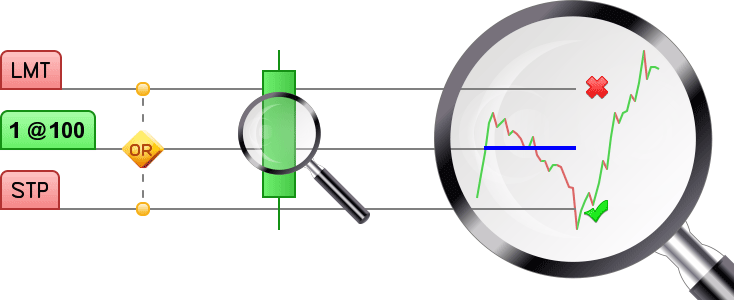
- This new system allows more accurate backtesting than ever before.
Improved detailed report
- Improved detailed report page including performance chart. You can view weekly, monthly, quarterly or yearly performance.
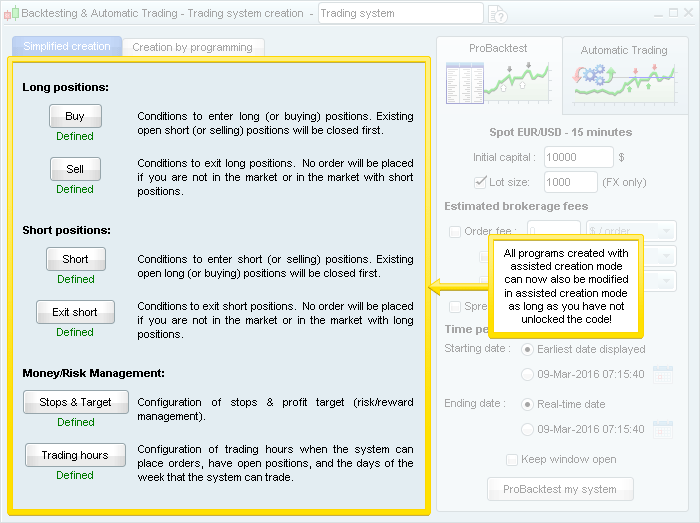
Easier strategy creation and modification
Assisted creation mode has been improved to give you more options and flexibility without programming.
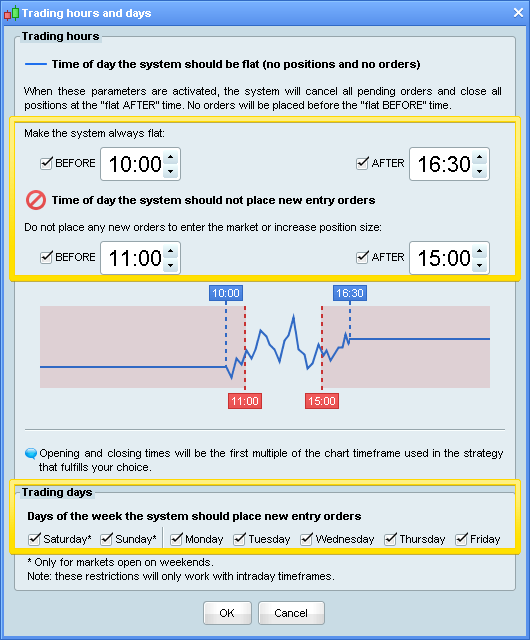
- You can now define days of the week and times of day the system can trade in assisted creation mode
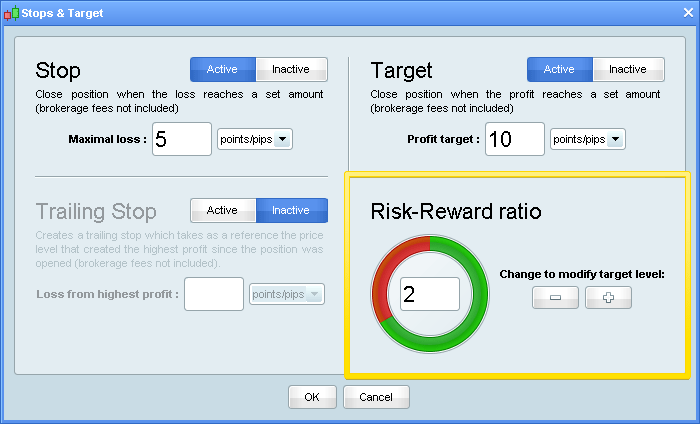
- You can also configure risk-reward ratio in assisted creation mode and the software will adjust your target accordingly
- After creating a strategy or market scan with simplified creation mode, you can now also modify it without programming!
- Strategies and market scans created with simplified creation mode will now have locked code by default.
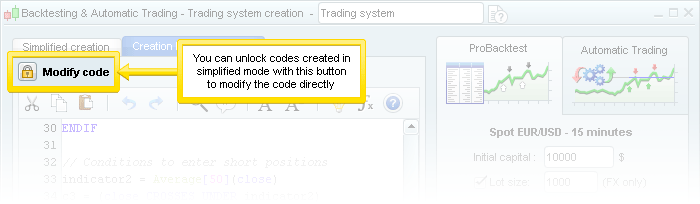
- Strategies and market scans created by programming will have unlocked code by default.
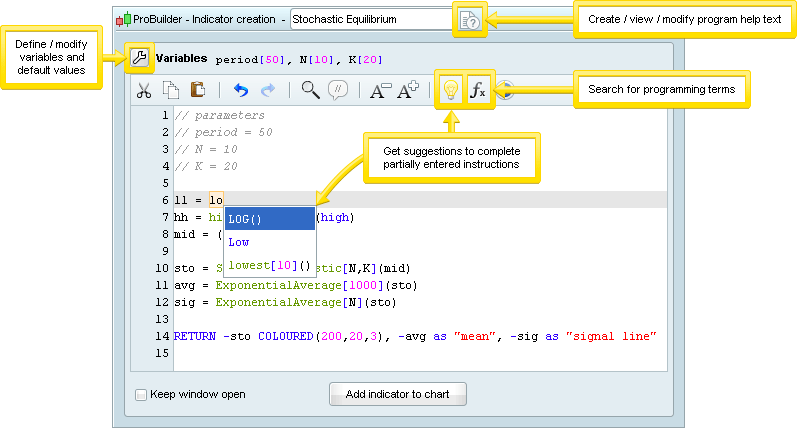
Code editor
- You can now open different coding windows at once (for example to work on an indicator and a strategy at the same time or 3 strategies)!
- Space available to code has been significantly enlarged in all code editors (Trading strategies, indicators and screeners)
- Code description has been moved to a dedicated icon next to the title
- The new "light bulb" icon (or ctrl+space keyboard shortcut) lets you click on an incomplete word and the code editor will suggest terms for you!
- You can now search for functions in the "add function" menu
- Variable optimization has been moved to the top bar and the design of the window has been simplified
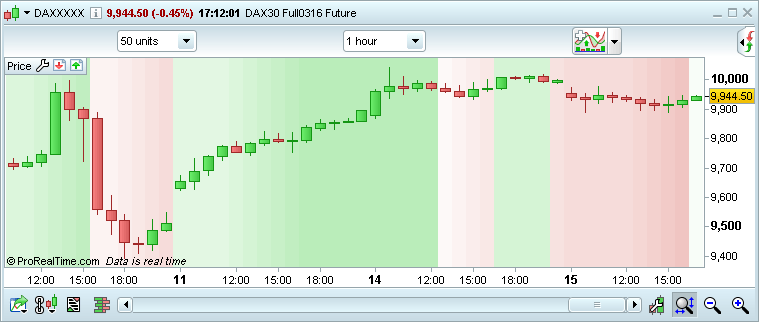
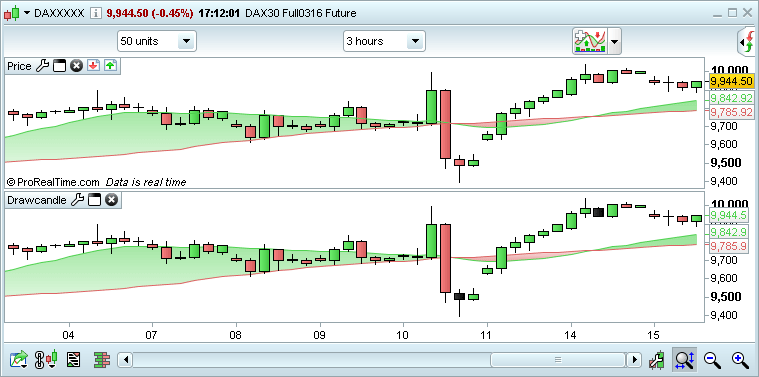
The programming language now lets you draw objects and candles on charts with programming in your custom ProBuilder indicators.
- BackgroundColor: lets you color the background of the chart or specific bars (such as odd/even days). The colored zone starts halfway between the previous bar and the next bar. Example: BACKGROUNDCOLOR(0,127,255,25) It is possible to use a variable for the colors if you want the background color to change based on your conditions. Example: BACKGROUNDCOLOR(0,color,255,25)
- DrawBarChart: Draws a custom bar on the chart. Open, high, low and close can be constants or variables. Example: DRAWBARCHART(open,high,low,close) COLOURED(0,255,0)
- DrawCandle: Draws a custom candlestick on the chart. Open, high, low and close can be constants or variables. Example: DRAWCANDLE(open,high,low,close) COLOURED(0,255,0)
- DrawArrow: Draws an arrow pointing right. You need to define a point for the arrow (x and y axis). You can also choose a color. Example: DRAWARROW(x1,y1) COLOURED(R,V,B,a) This is useful to add visual buy signals.
- DrawArrowUp: Draws an arrow pointing up. You need to define a point for the arrow (x and y axis). You can also choose a color. Example: DRAWARROWUP(x1,y1) COLOURED(R,V,B,a) This is useful to add visual buy signals.
- DrawArrowDown: Draws an arrow pointing down. You need to define a point for the arrow (x and y axis). You can also choose a color. Example: DRAWARROWDOWN(x1,y1) COLOURED(R,V,B,a) This is useful to add visual sell signals.
- DrawRectangle: Draws a rectangle on the chart. Example: DRAWRECTANGLE(x1,y1,x2,y2) COLOURED(R,V,B,a)
- DrawEllipse: Draws an ellipse on the chart. Example: DRAWELLIPSE(x1,y1,x2,y2) COLOURED(R,V,B,a)
- DrawLine: Draws a line on the chart. Example: DRAWLINE(x1,y1,x2,y2) COLOURED(R,V,B,a)
- DrawHLine: Draws a horizontal line on the chart. Example: DRAWHLINE(x1,y1,x2,y2) COLOURED(R,V,B,a)
- DrawVLine: Draws a vertical line on the chart. Example: DRAWVLINE(x1,y1,x2,y2) COLOURED(R,V,B,a)
- DrawSegment: Draws a segment on the chart. Example: DRAWSEGMENT(x1,y1,x2,y2) COLOURED(R,V,B,a) Example: DRAWSEGMENT(barindex, close, barindex[5], close[5])
- DrawText: Adds a text field to the chart with the text of your choice at the specified location. Example: DRAWTEXT("your text",x1,y1) COLOURED(R,V,B,a)
- DrawOnLastBarOnly: Parameter that lets you draw drawn objects on the last bar only. This parameter should always be used with "CalculateOnLastBars" to optimize calculations. Example: DEFPARAM DRAWONLASTBARONLY = true
- CalculateOnLastBars: Parameter that lets you increase the speed at which indicators are calculated by defining the number of bars to display the results, starting with the most recent bar. Example: DEFPARAM CALCULATEONLASTBARS = 200
Option chain and scenario tools
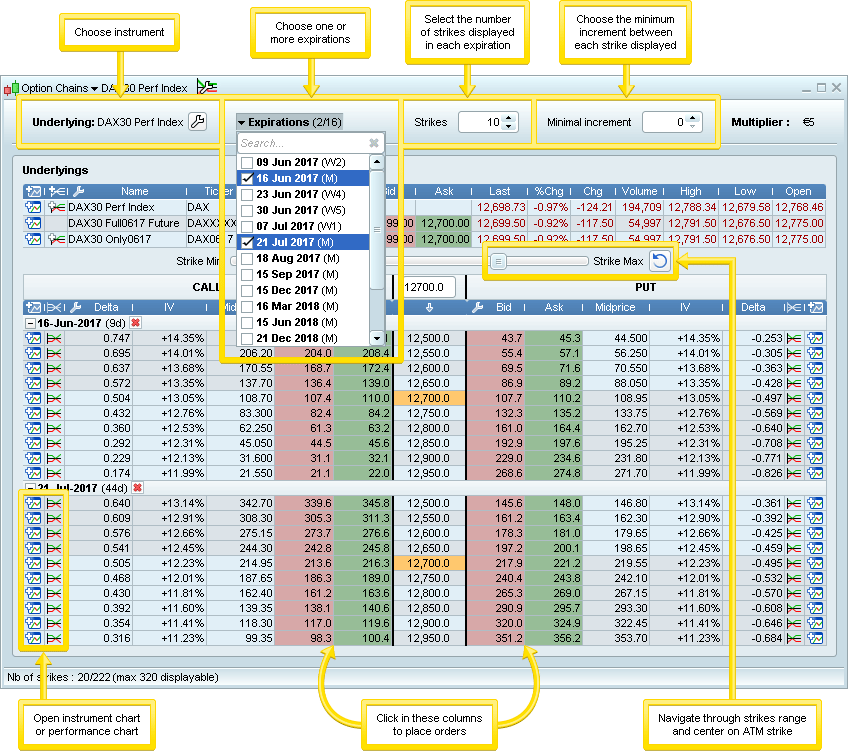
Options chain window
- New option chain window available
- Search for an underlying instrument using the search bar, then select it to display related options
- You can choose an expiration date and filter by minimum and maximum strike price
- You can place orders by clicking in the ask or bid columns
- Performance charts can be opened by clicking on the %icon_chain% icon
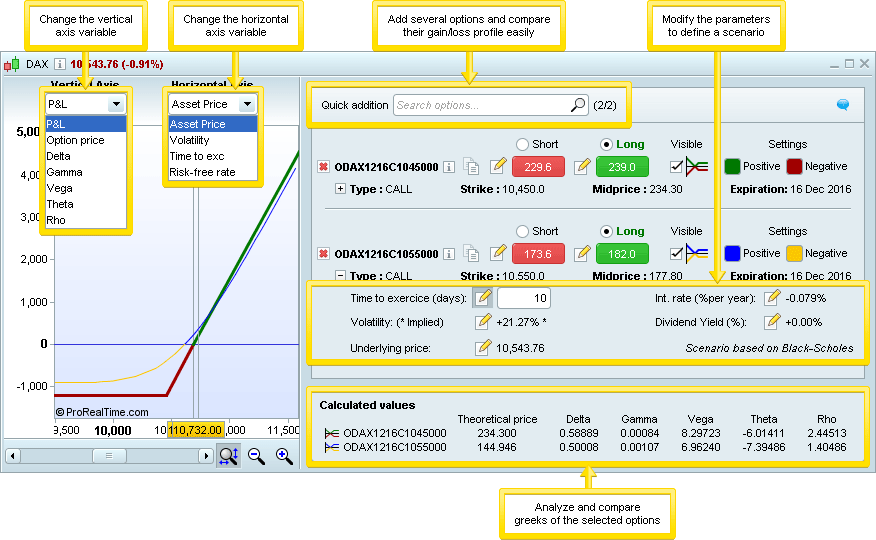
Options scenario tool
- This new window lets you analyze and compare different option prices
- View and compare the profit profile depending on the price of the underlying asset, the volatility, or the time remaining until exercise
- Create scenarios and analyze their impact on gain at maturity and greeks
- Each parameter may be manually defined or based on the latest real-time information
- Trade options directly from the pricer window
Other improvements
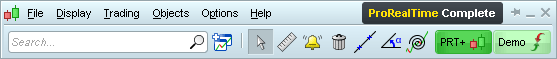
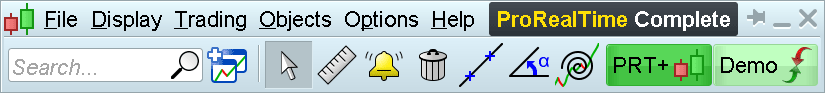
- Icons in the platform now adapt better to larger font sizes
SMALLER FONT & ICONS
LARGER FONT & ICONS
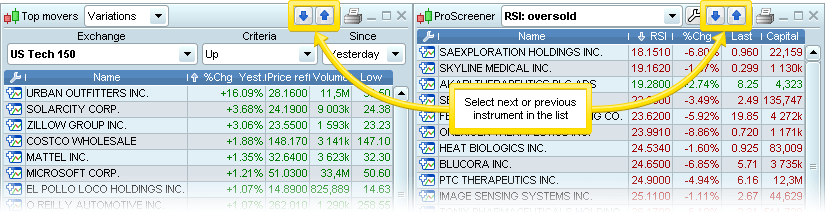
- New up and down arrows to select the next or previous item in lists (including ProScreener and top movers)
- New order book option to calculate equilibrium price during pre-opening market phases
- New option to transfer all objects to inferior time units in the "General options" section of the "Options" menu
- Improved cursor details window
- Improved technical support request window
- Improved graphics for ultra high definition montiors (>150 dots per inch)