Platform redesign
The platform has been redesigned with 2 objectives:
- allowing you to display more useful information in a smaller area
- saving you time by requiring less clicks to use platform features
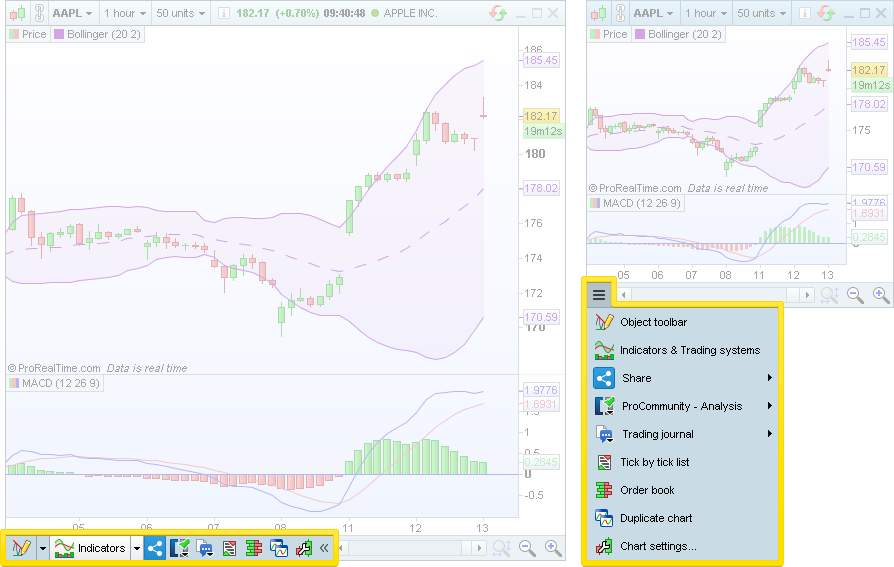
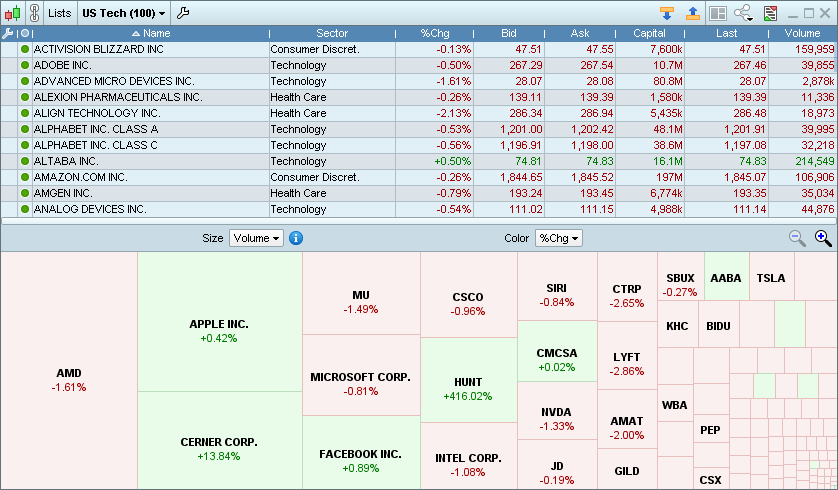
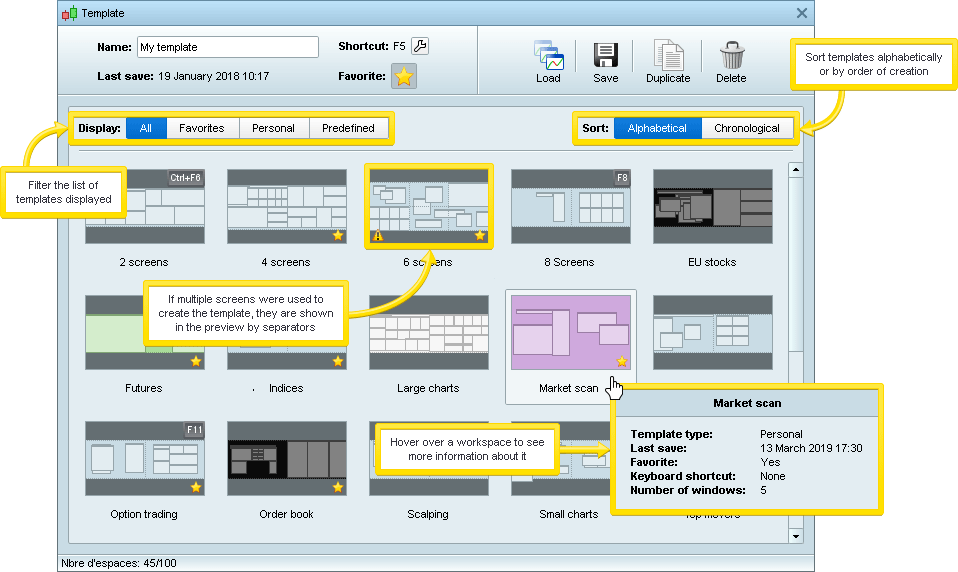
Main window
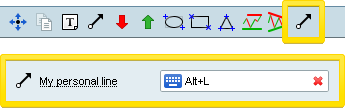
The objects toolbar can be displayed or hidden from the main window.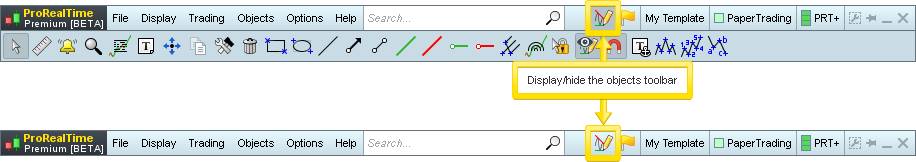
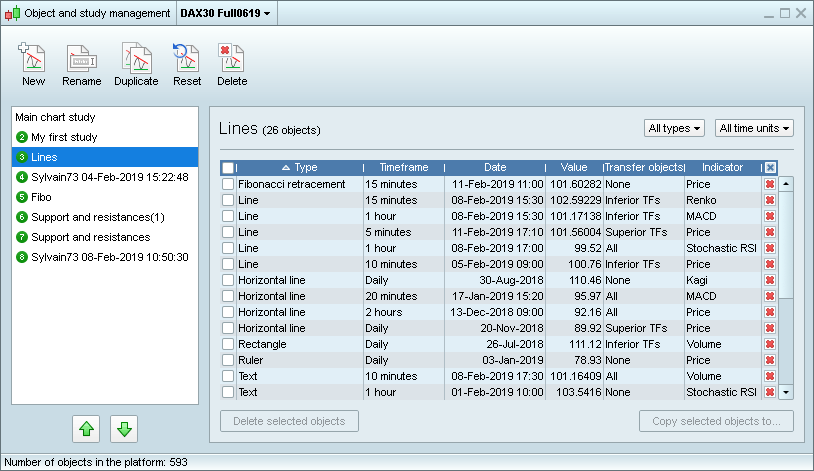
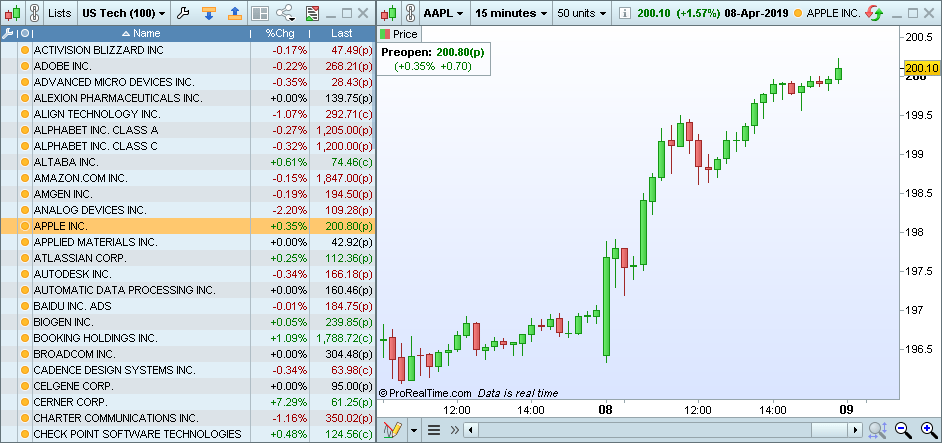
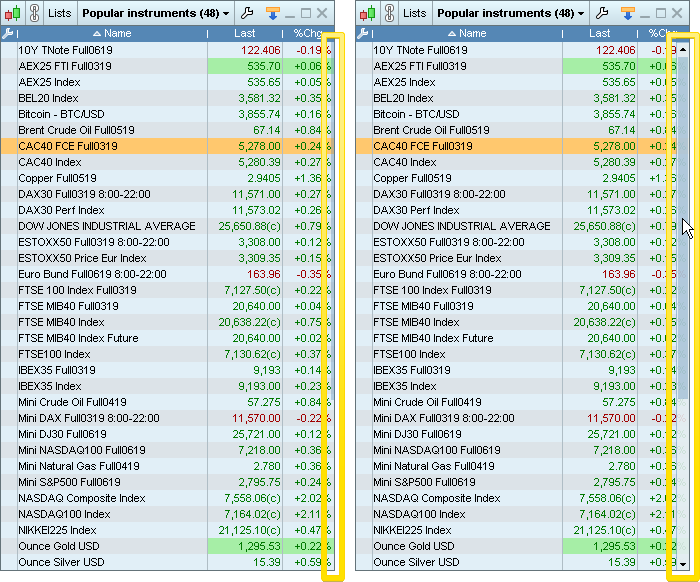
Lists scrollbars
Scrollbars in lists only appear when the mouse hovers over the window to save screen space.
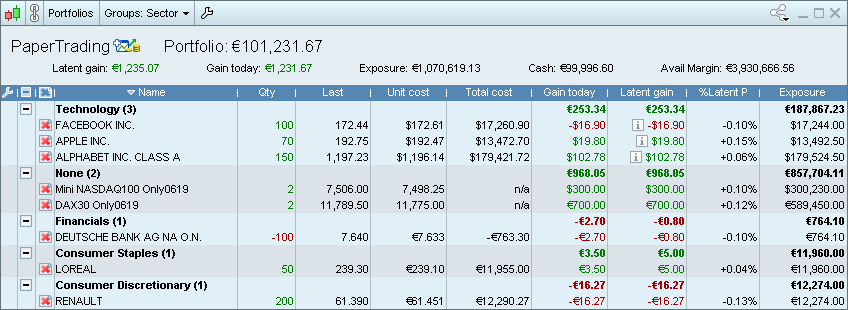
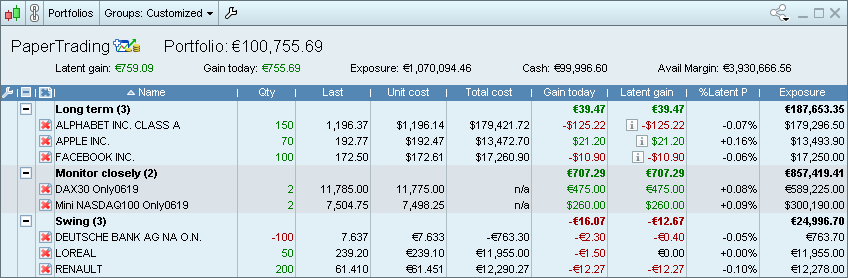
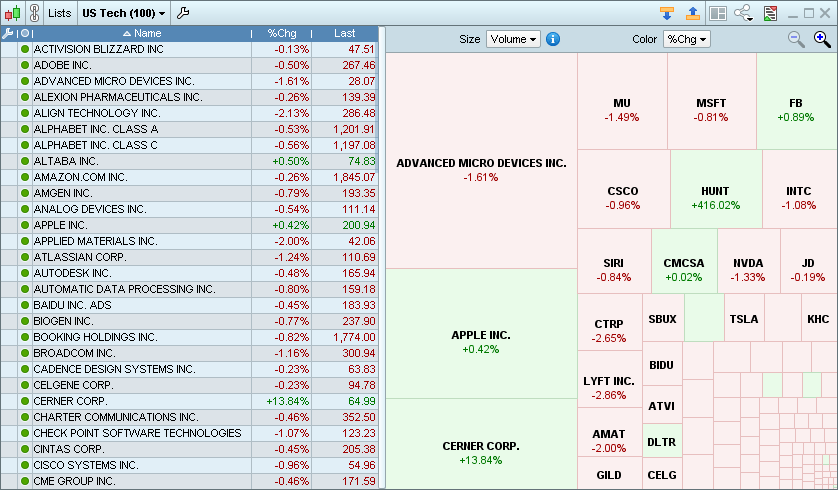
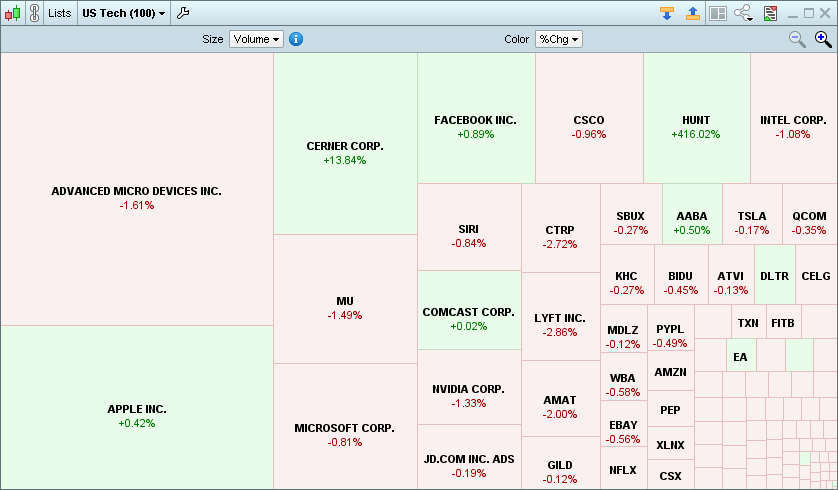
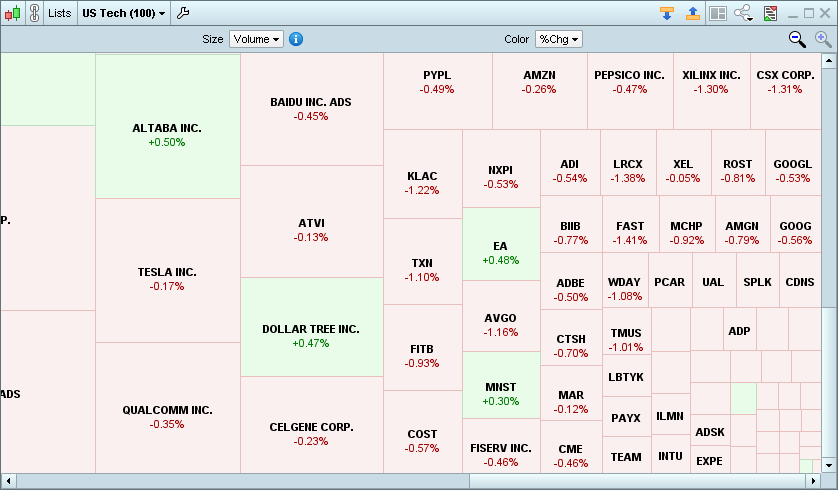
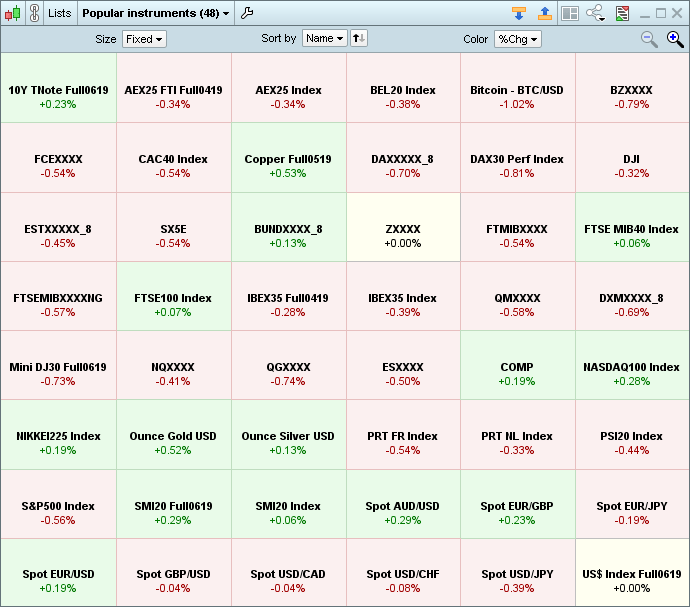
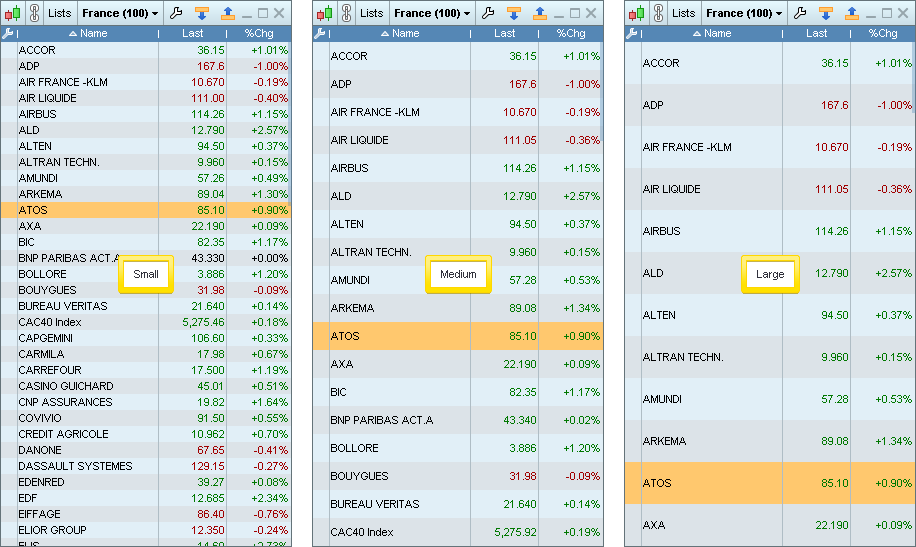
Lists density
You can now choose between a fixed density for your lists (small, medium, large) or an automatically defined density based on list size.
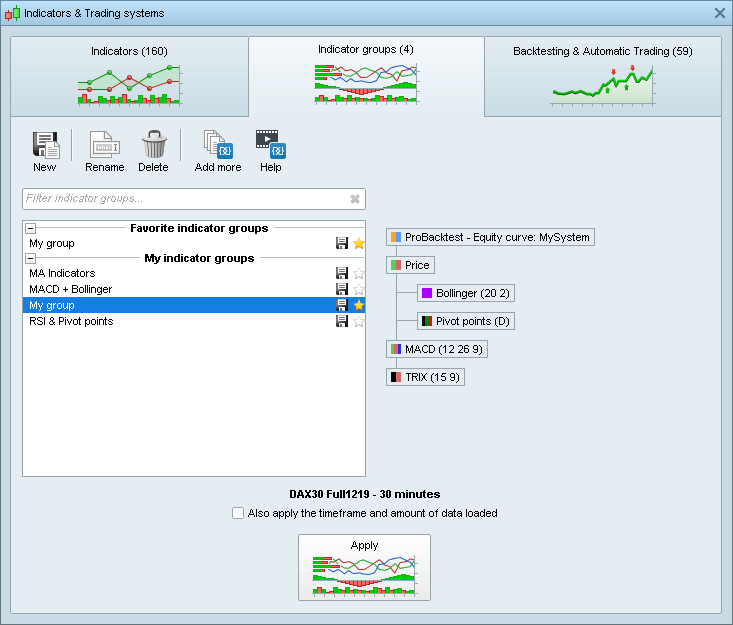
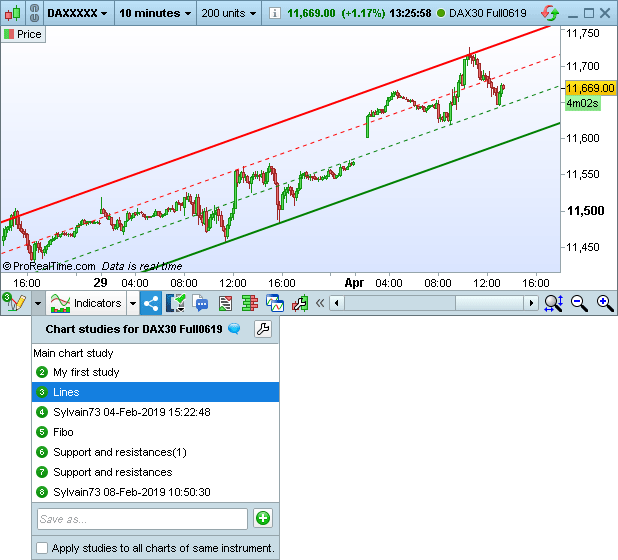
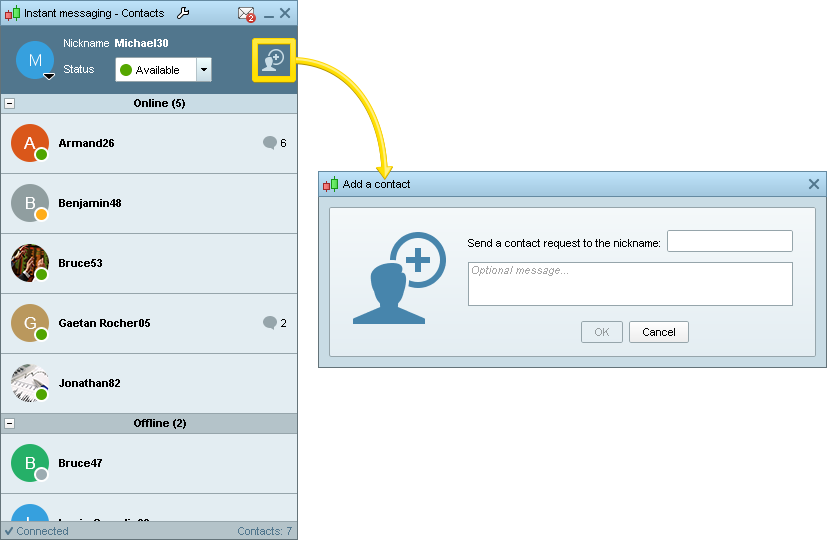
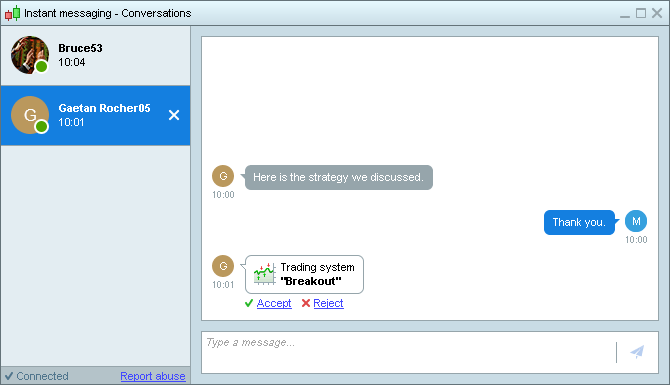
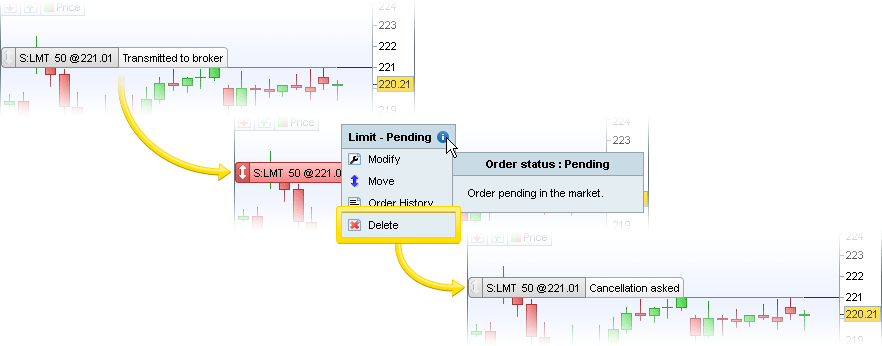
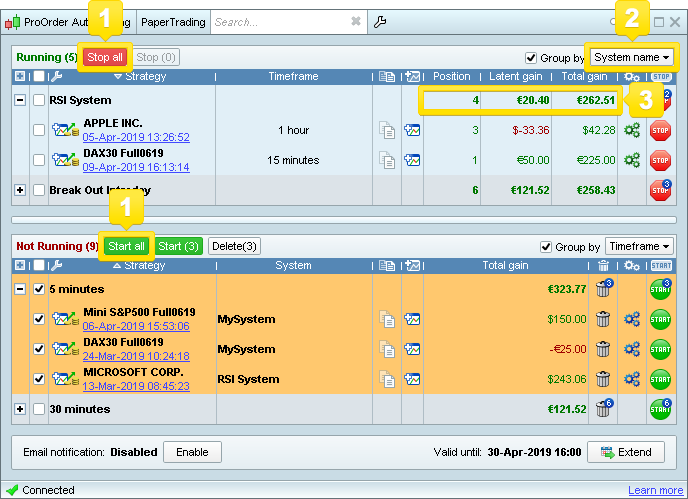
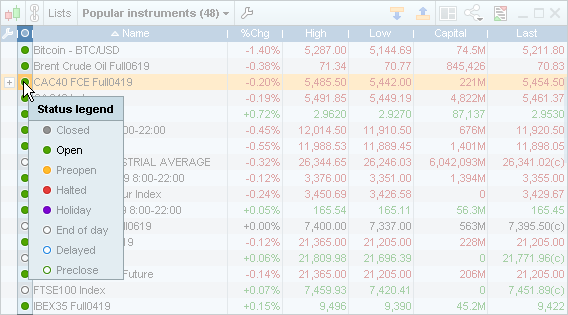
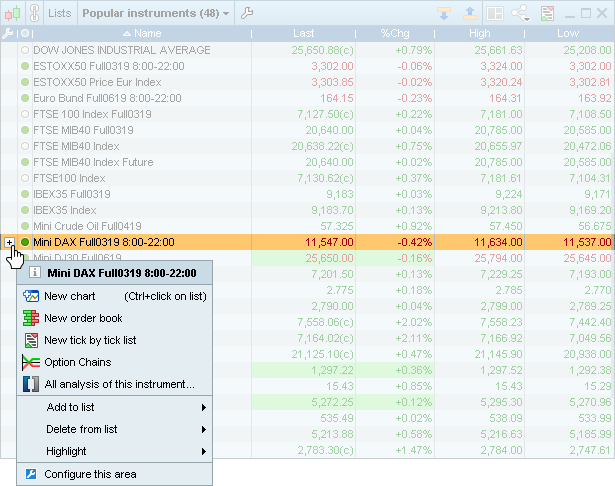
Quick access from lists
Click on the [+] icon in the lists to quickly access features such as opening a chart or order book on the instrument, displaying analysis on the instrument, ...
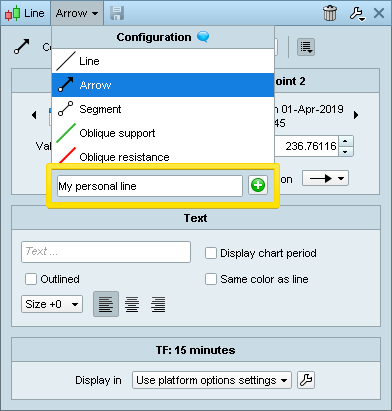
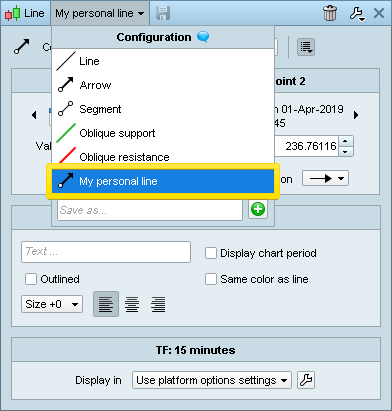
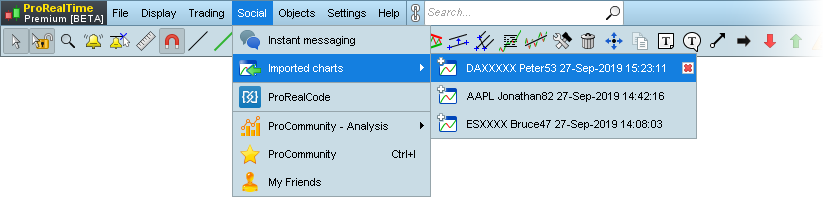
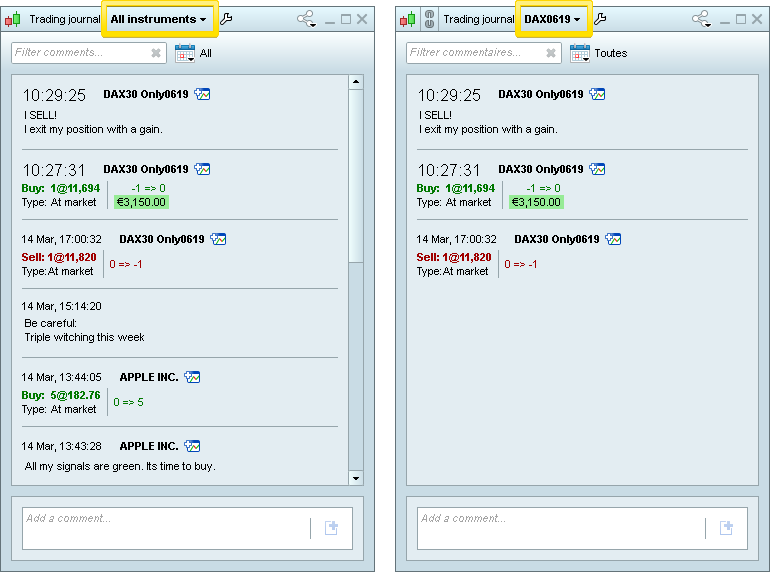
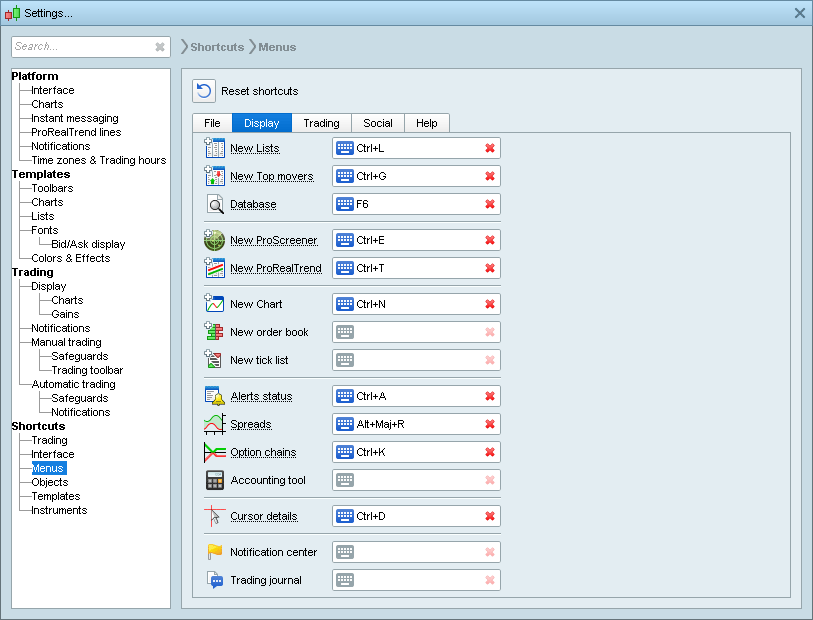
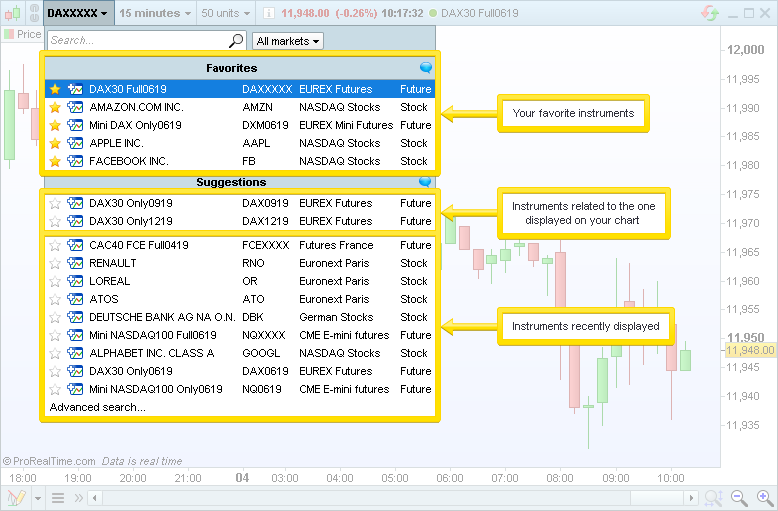
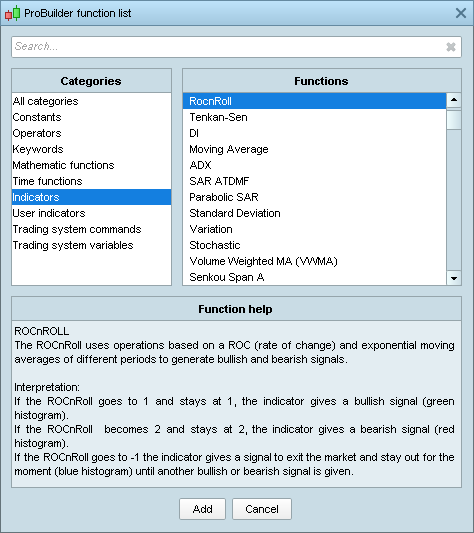
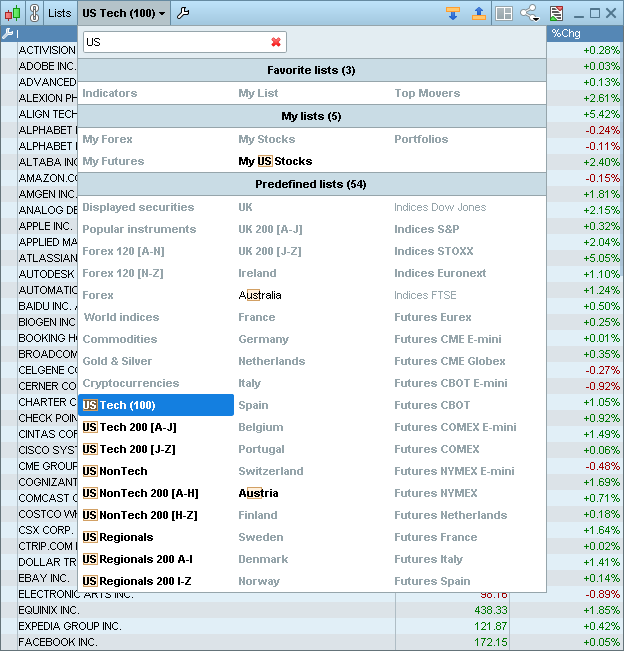
Dropdown menus
The new dropdown menus are displayed in columns to make it easier to find what you are looking for and include a search bar.
Move all windows simultaneously
You can now move all windows on a single screen at once by using ctrl + clicking on the title bar.
This is useful to transfer multiple windows from one screen to another. You can then use the multi-window feature in the options menu to fit all windows to the new screen size.
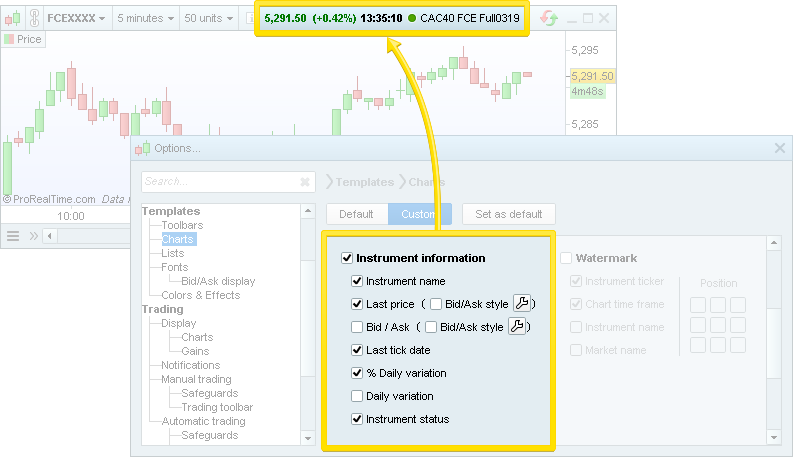
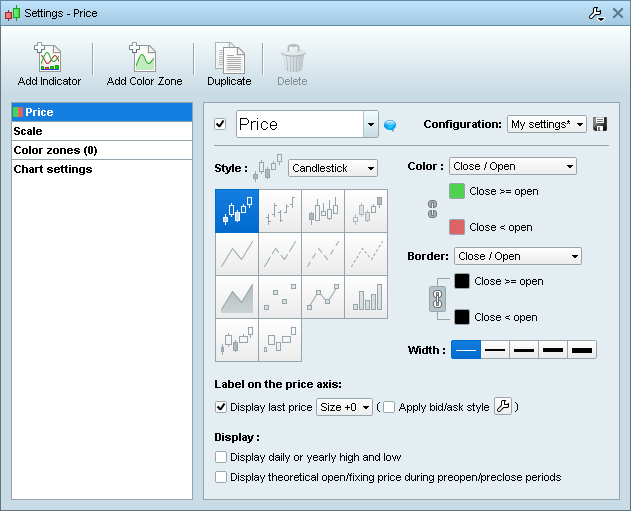
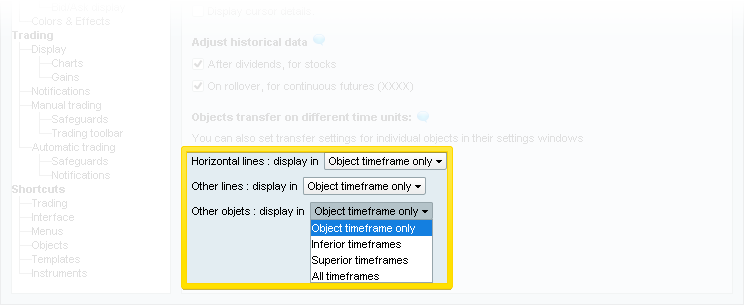
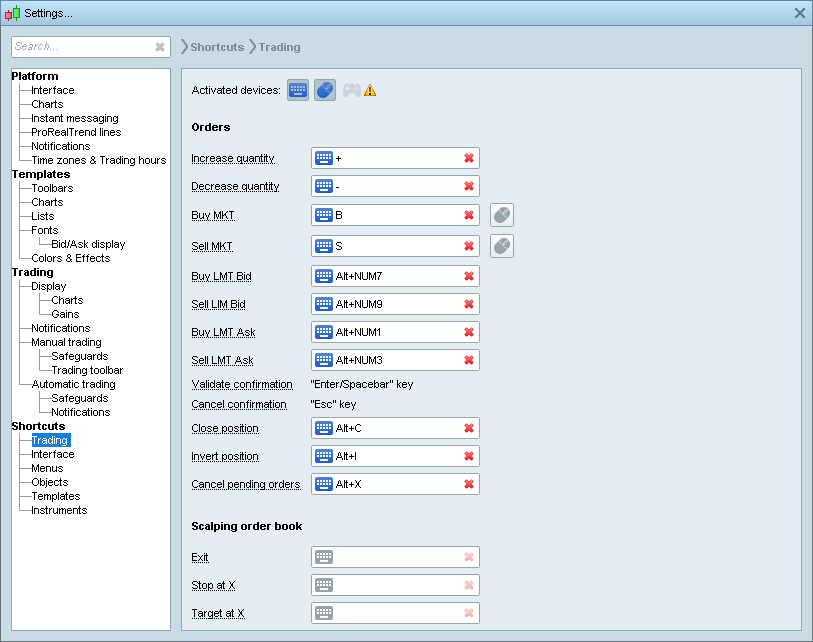
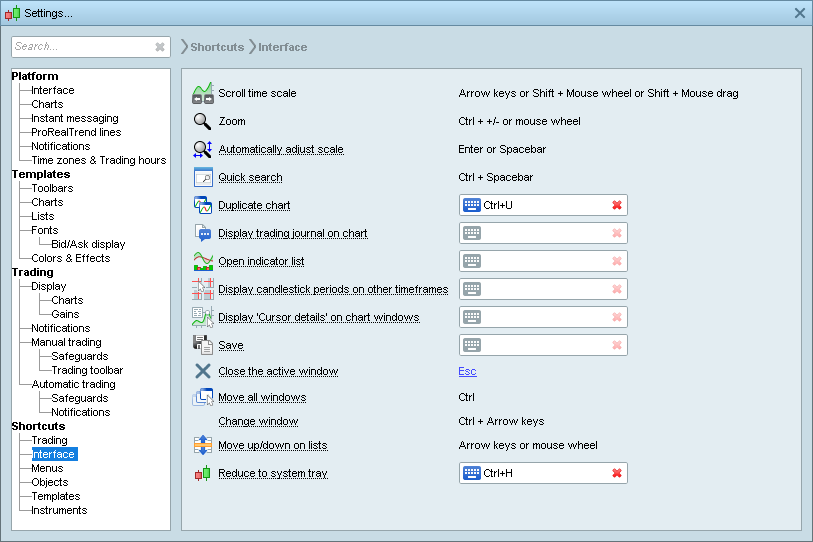
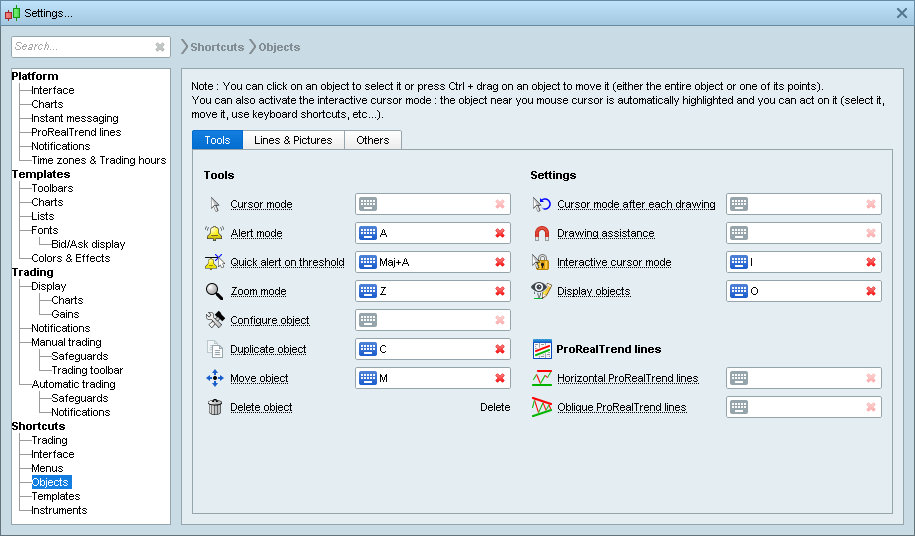
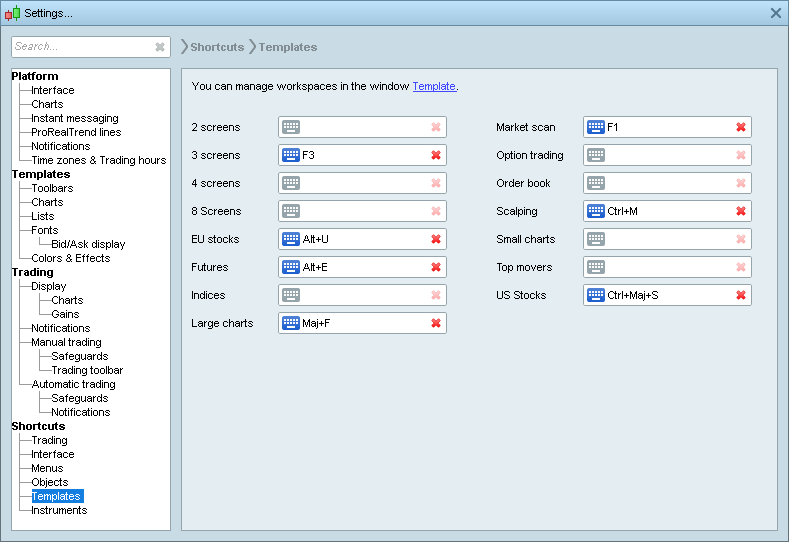
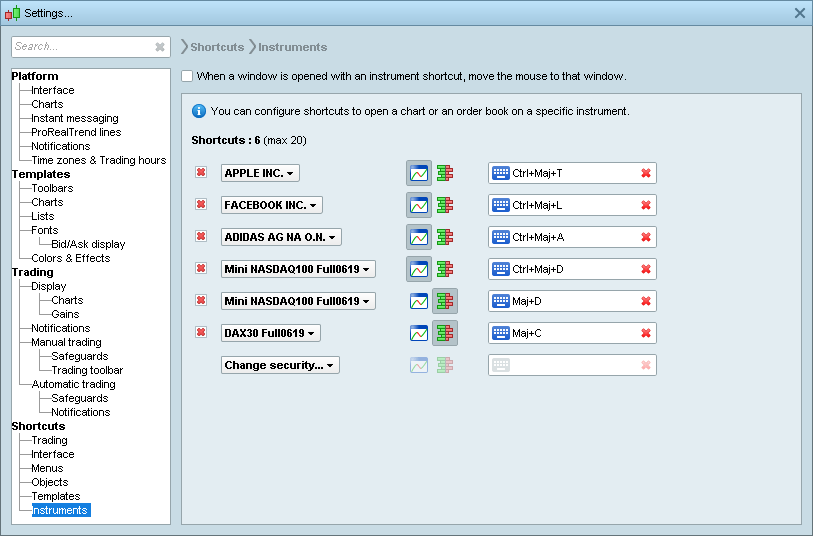
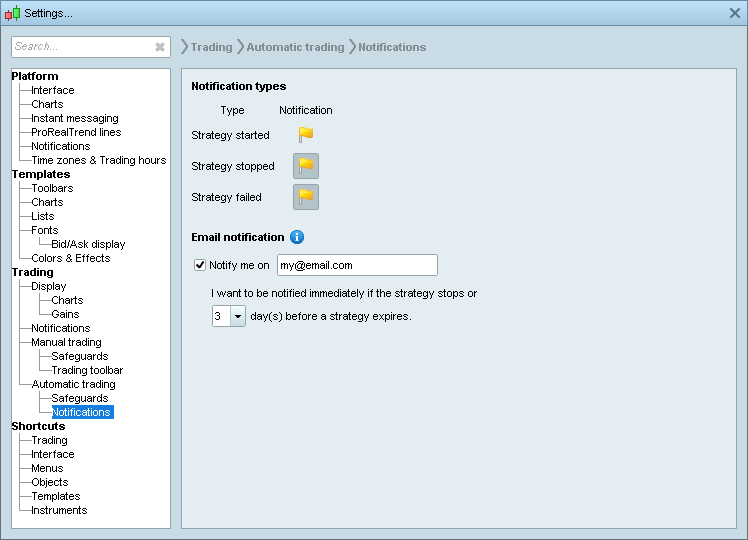
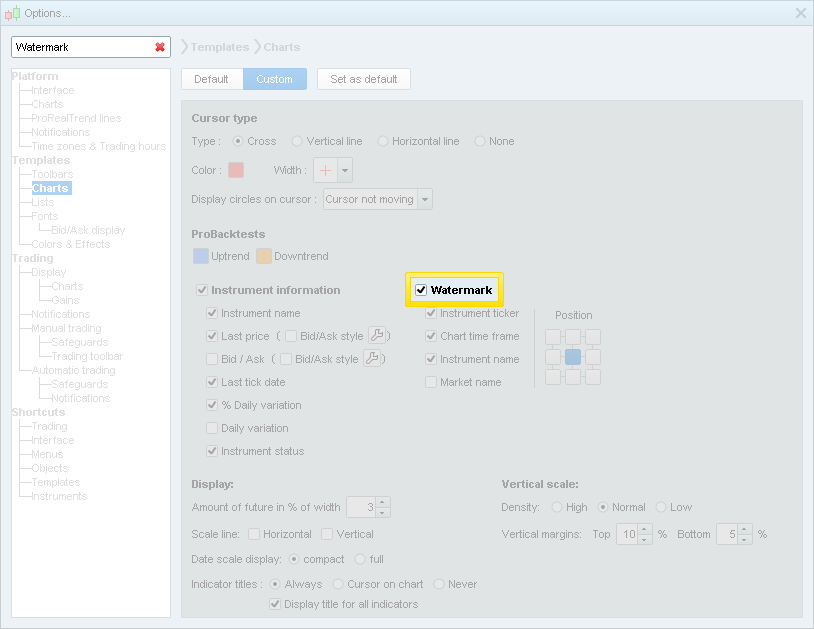
Find settings more easily
The options menu has been re-designed and now includes a search bar to allow you to find more easily the settings you are looking for.
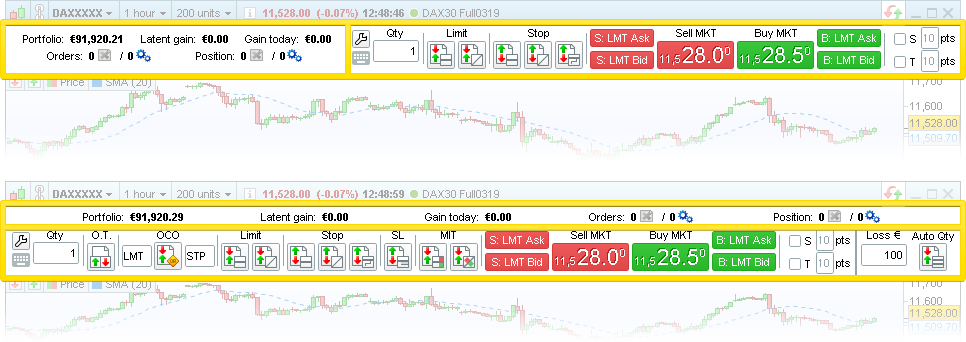
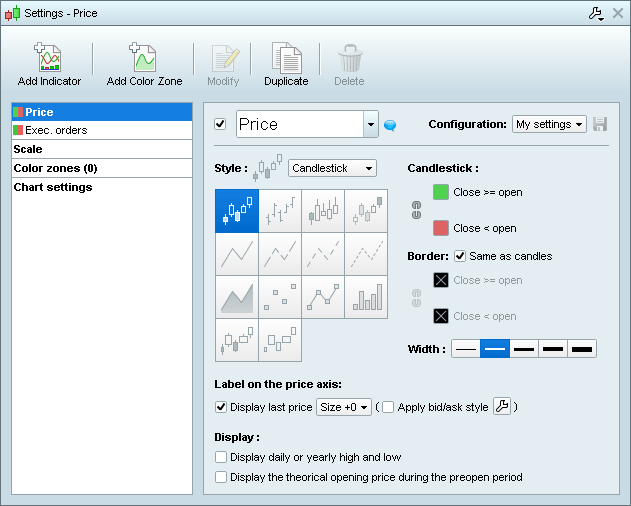
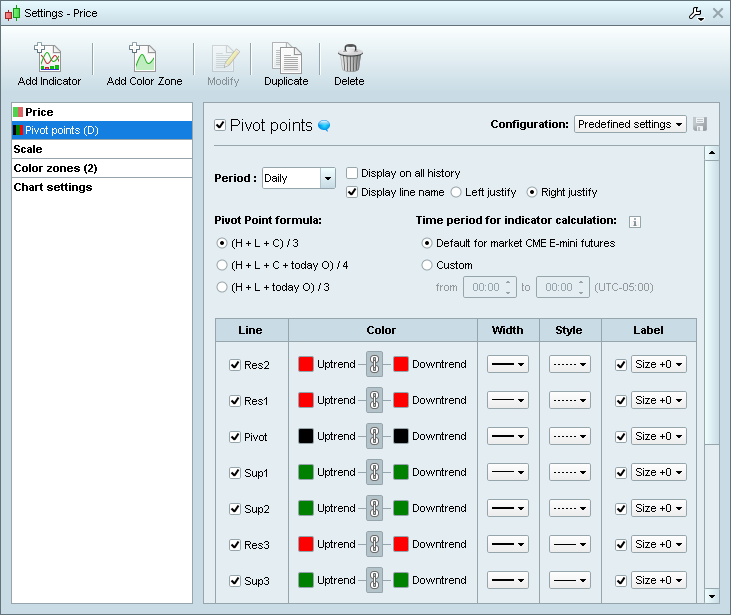
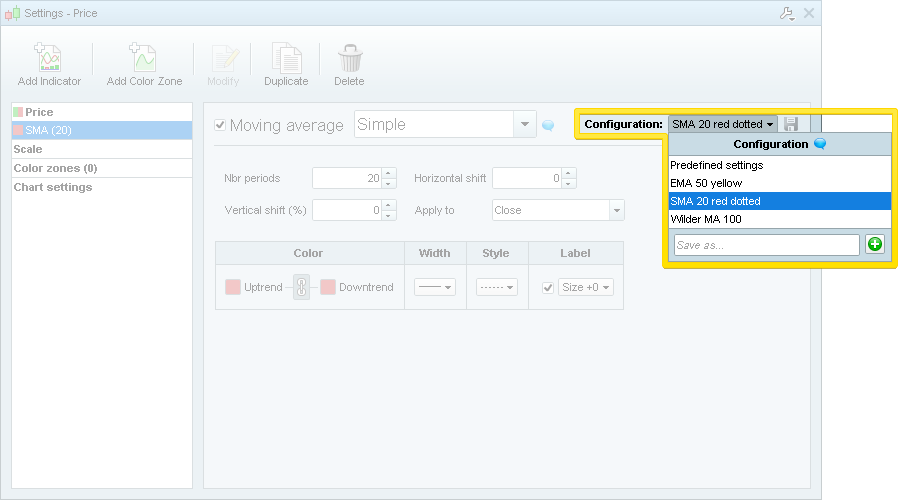
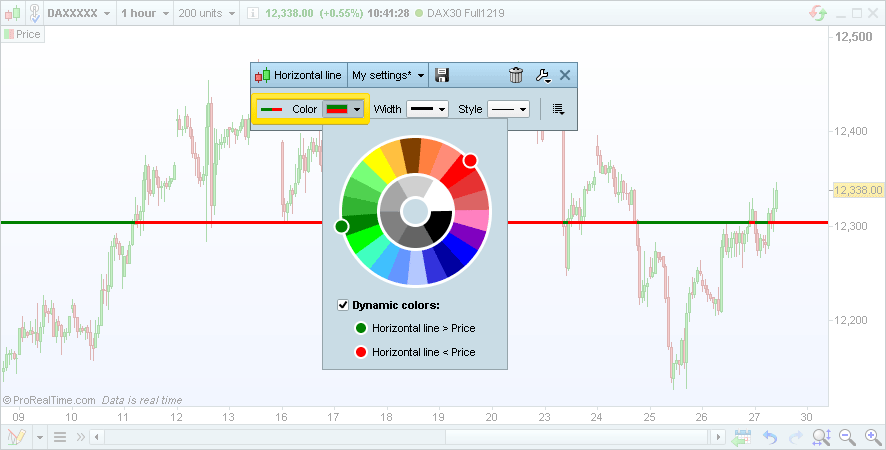
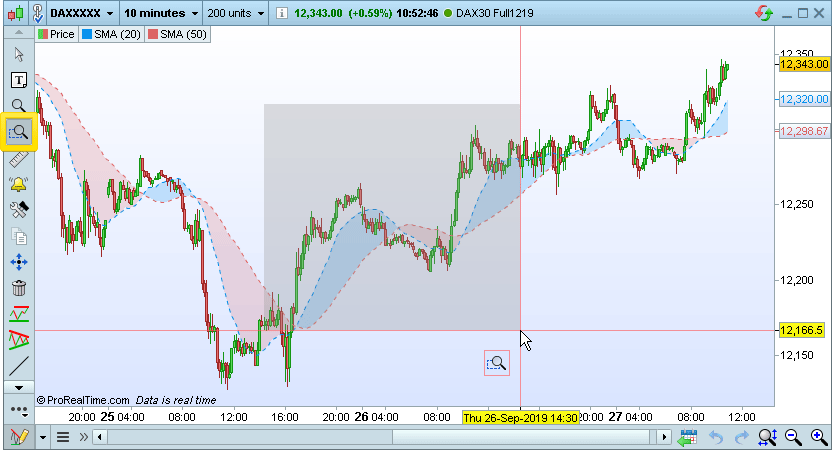
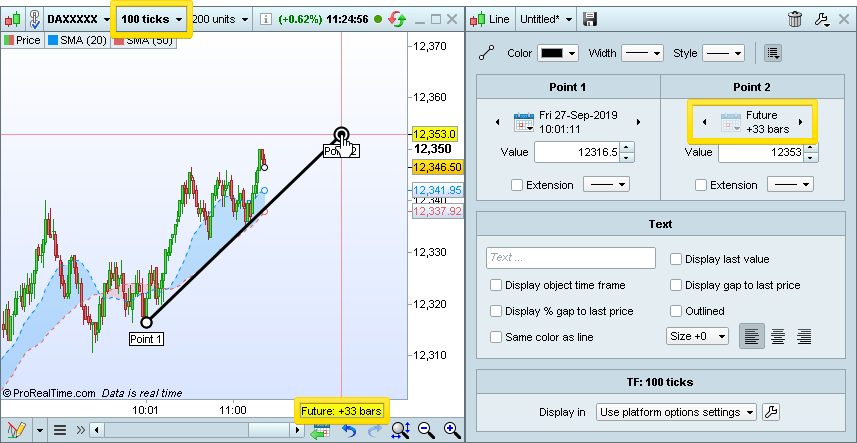
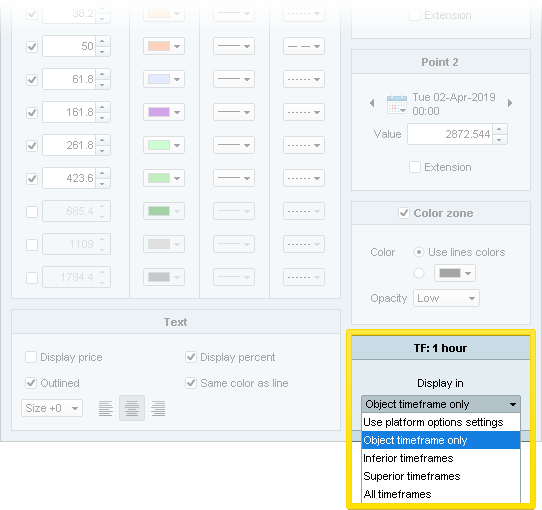
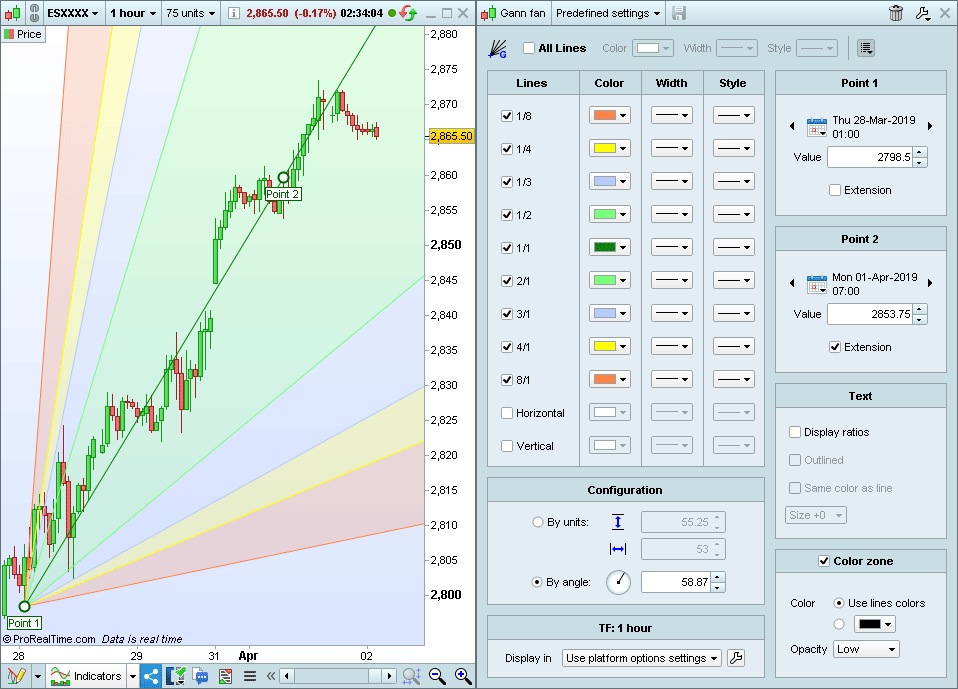
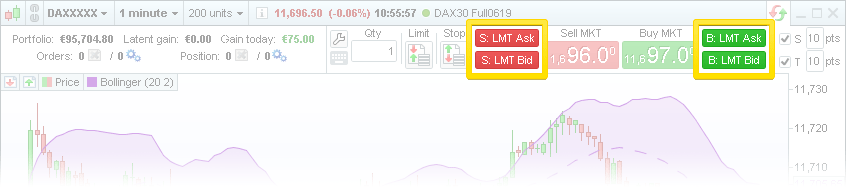
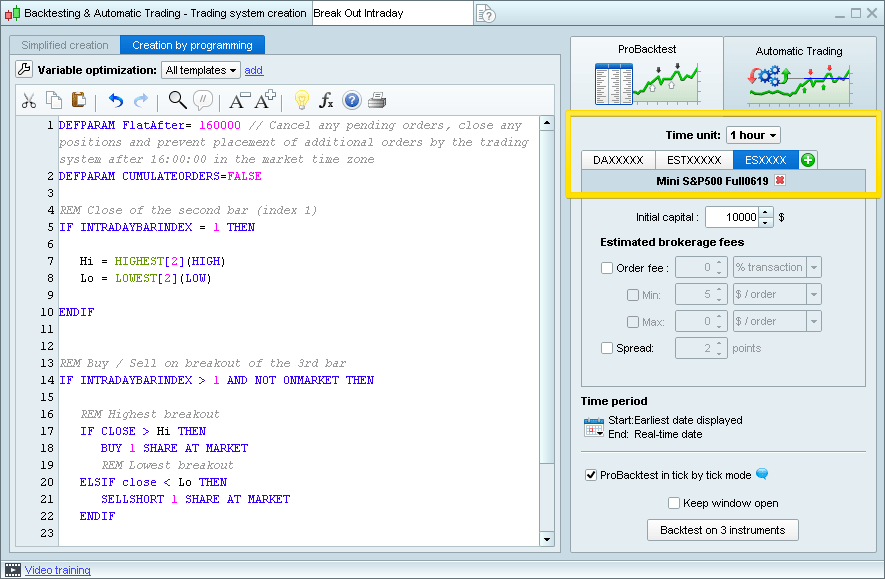
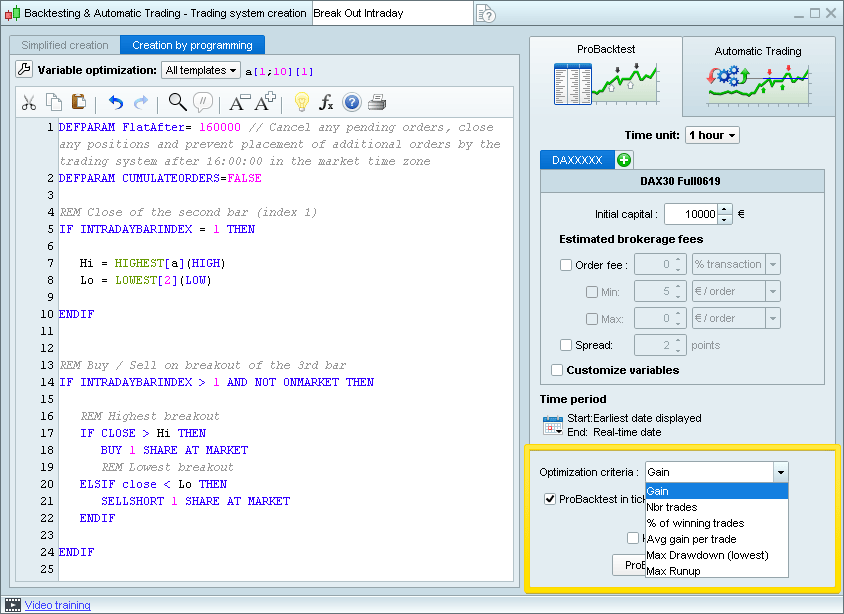
Quick configuration mode
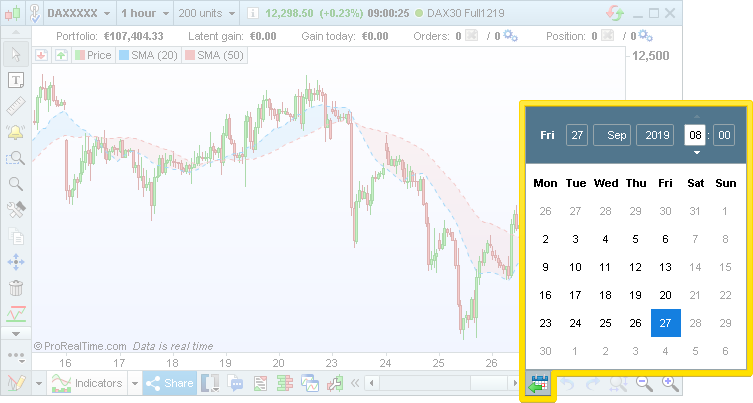
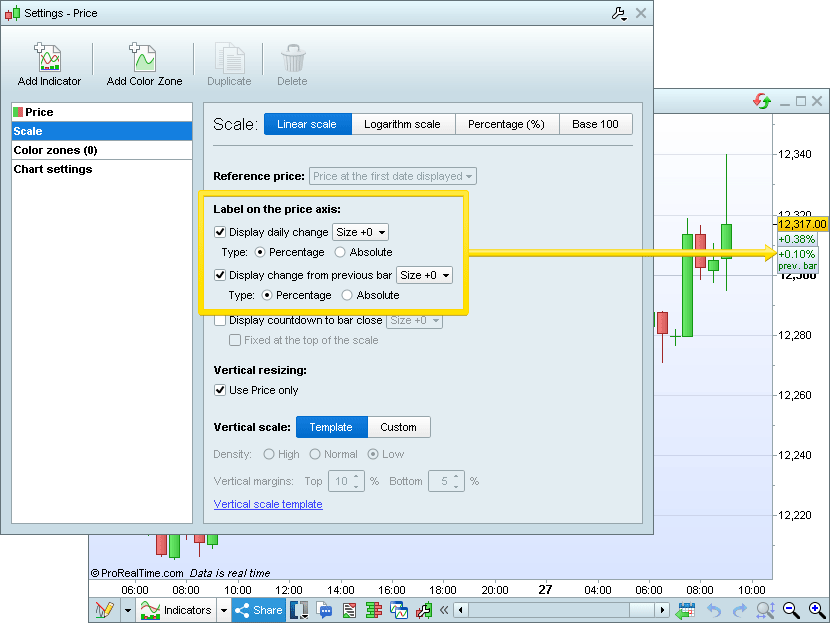
A quick configure button is now available in several windows of the platform. This enables configuration mode which lets you select a zone of the window to immediately open the configuration options of the related zone.