First steps with ProRealTime
Getting started with ProRealTime in just 15 minutes
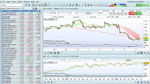
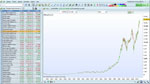
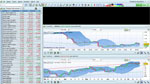
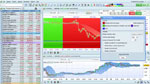
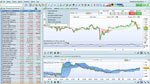
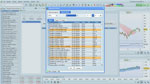
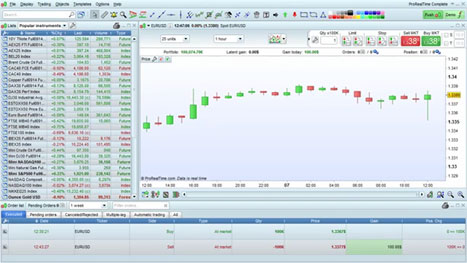
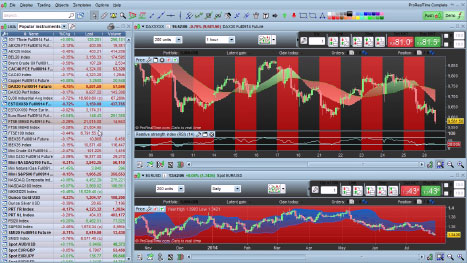
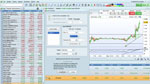
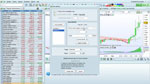
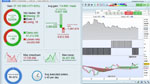
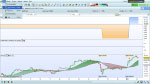
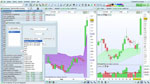
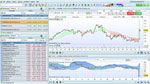
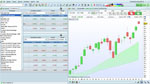
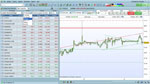
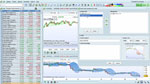
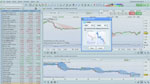
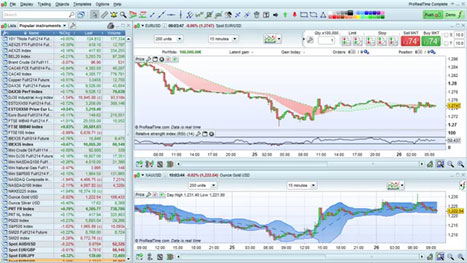
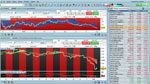
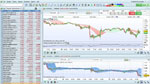
This video shows an example of how to create different workspaces for analyzing different instruments, place trades and analyze the market.
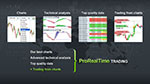
Learn about the advantages of ProRealTime, including top quality charts, technical analysis, data and trading tools.
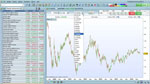
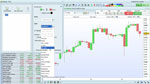
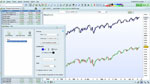
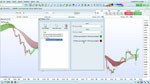
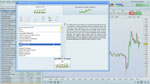
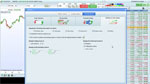
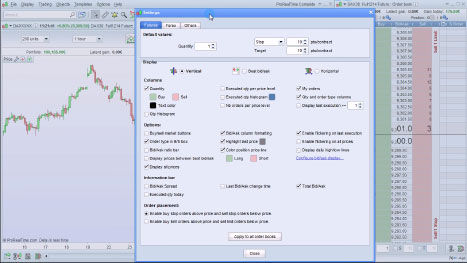
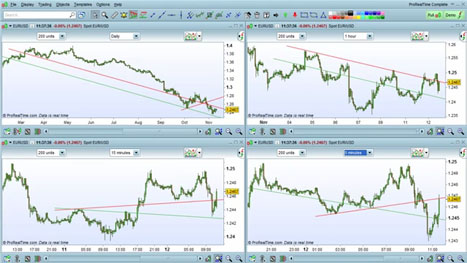
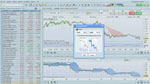
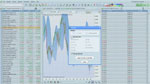
Saving different templates and the platform
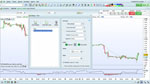
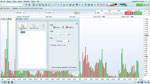
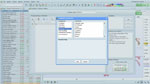
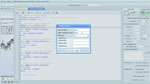
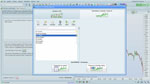
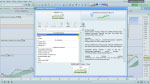
You can save different templates and quickly switch between them. You can also save your work with the "File" > "Save" option.
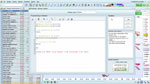
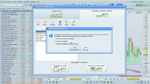
Help and support tools are available directly from the platform via the options in the help menu.